


How we optimized rendering performance while handling thousands of annotations in React — Part 1
Table of contents

At Nutrient, performance is a key area, especially in our Web Viewer SDK. It’s crucial for our customers to deliver a smooth and snappy user experience (UX) for their document needs, directly out of the box.
Recently, we discovered some delays and stutters in the Web viewer when handling very large documents with thousands of annotations. These became particularly noticeable during certain interactions, such as zooming and panning. The viewer would become unresponsive for a few seconds when trying to zoom in or out of such documents, and panning would freeze the user interface (UI) for a few hundred milliseconds.
In this detailed blog, we’ll share our experience in identifying and fixing these performance issues in the Web viewer, which is built with React. These learnings can be applied to any React application.
Identifying performance bottlenecks
To optimize performance, we had to identify the bottlenecks first.
“It is a capital mistake to theorize before one has data.”
We prepared a massive test document with thousands of annotations and loaded it in the viewer. There was evident lag in rendering and interactions, especially when trying to zoom in and out, or when moving around the document.
React Dev Tools has a great profiler(opens in a new tab) that can help narrow down performance bottlenecks by measuring rendering performance of the React component tree and identifying problematic components. It was a good starting point, but we needed more detailed insights into the components. Profiler gives a good picture of which components are contributing to the rendering time, but it doesn’t give a detailed breakdown of which function calls or operations within those components are unintentionally blocking the main thread.
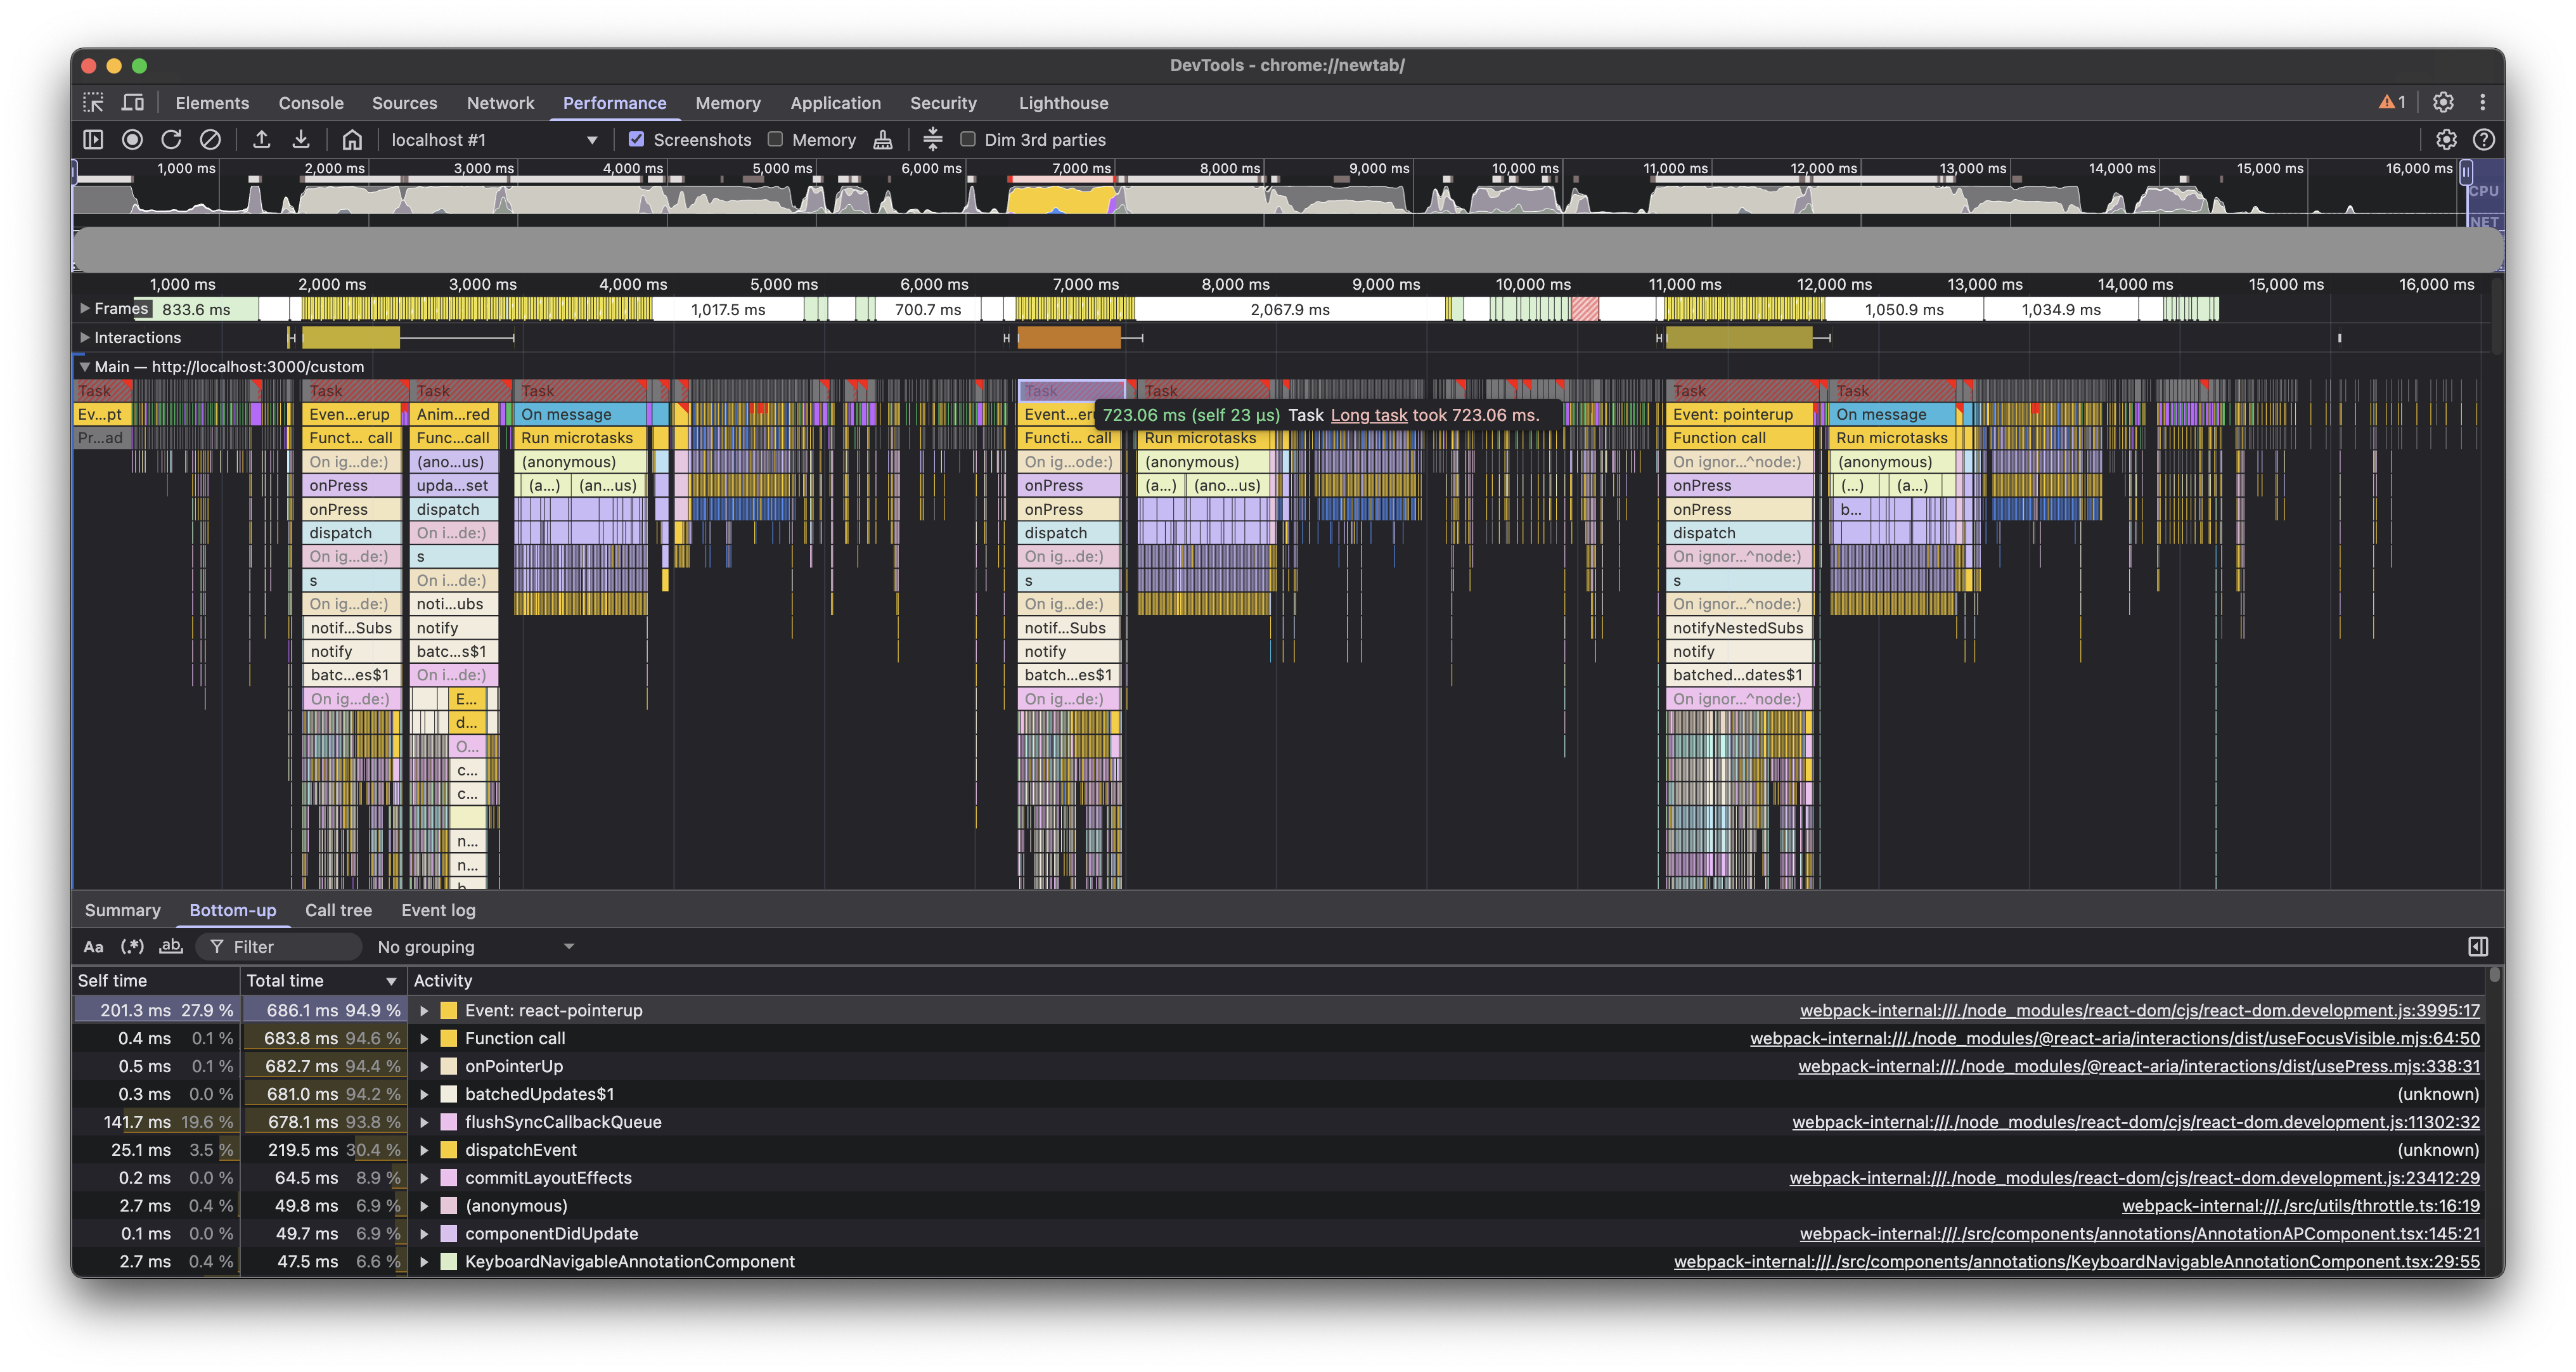
For a more granular analysis, we turned to the browser’s built-in performance profiling dev tools. We fired up the browser’s built-in performance profiler on a build of the Web viewer and started recording while zooming in on the document.
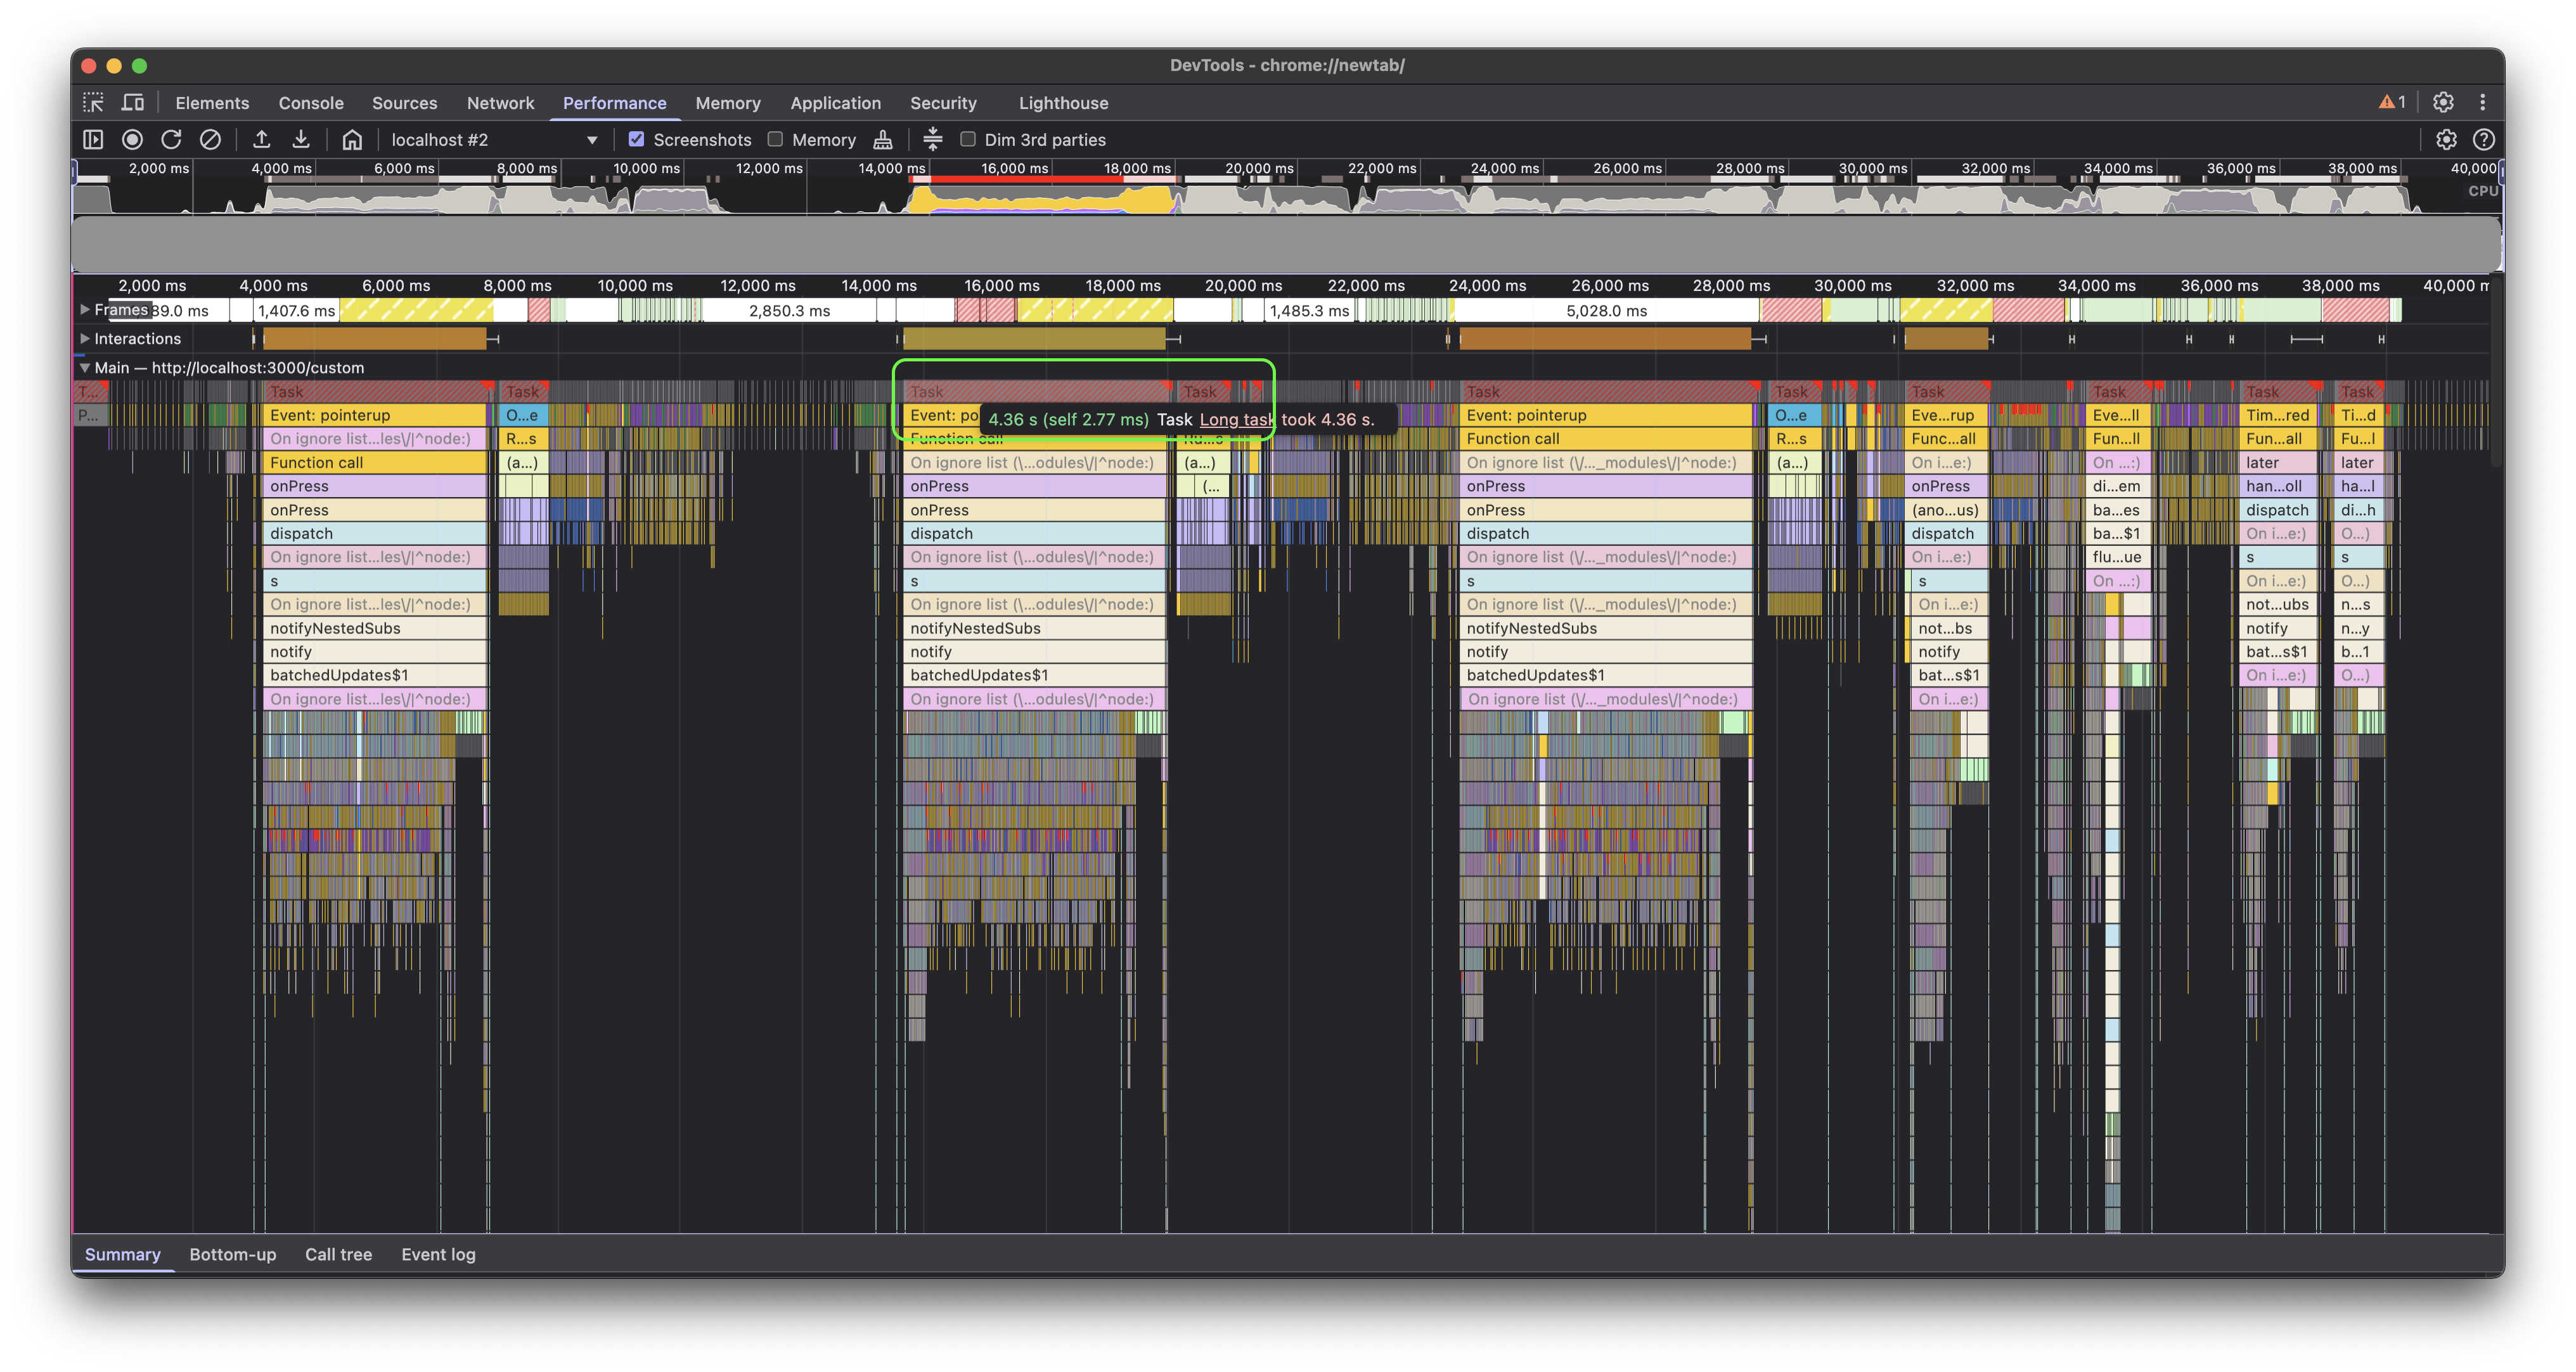
The profile above shows the baseline performance while zooming in on the test document multiple times. On average, we noticed it blocked the main thread for about 4.5 seconds (note the highlighted red bar for one zoom operation), which is quite high. This was followed by approximately 800 ms of microtasks(opens in a new tab), which is also significant, since a long sequence of microtasks can block the UI.
Once we knew the baseline, we could start digging deeper and improving the numbers.
Render blocking tasks
When digging into the long task(opens in a new tab) that occurred during the zoom operation and sorting child tasks by their duration, a function call stood out as something significant that could have been an easy win.
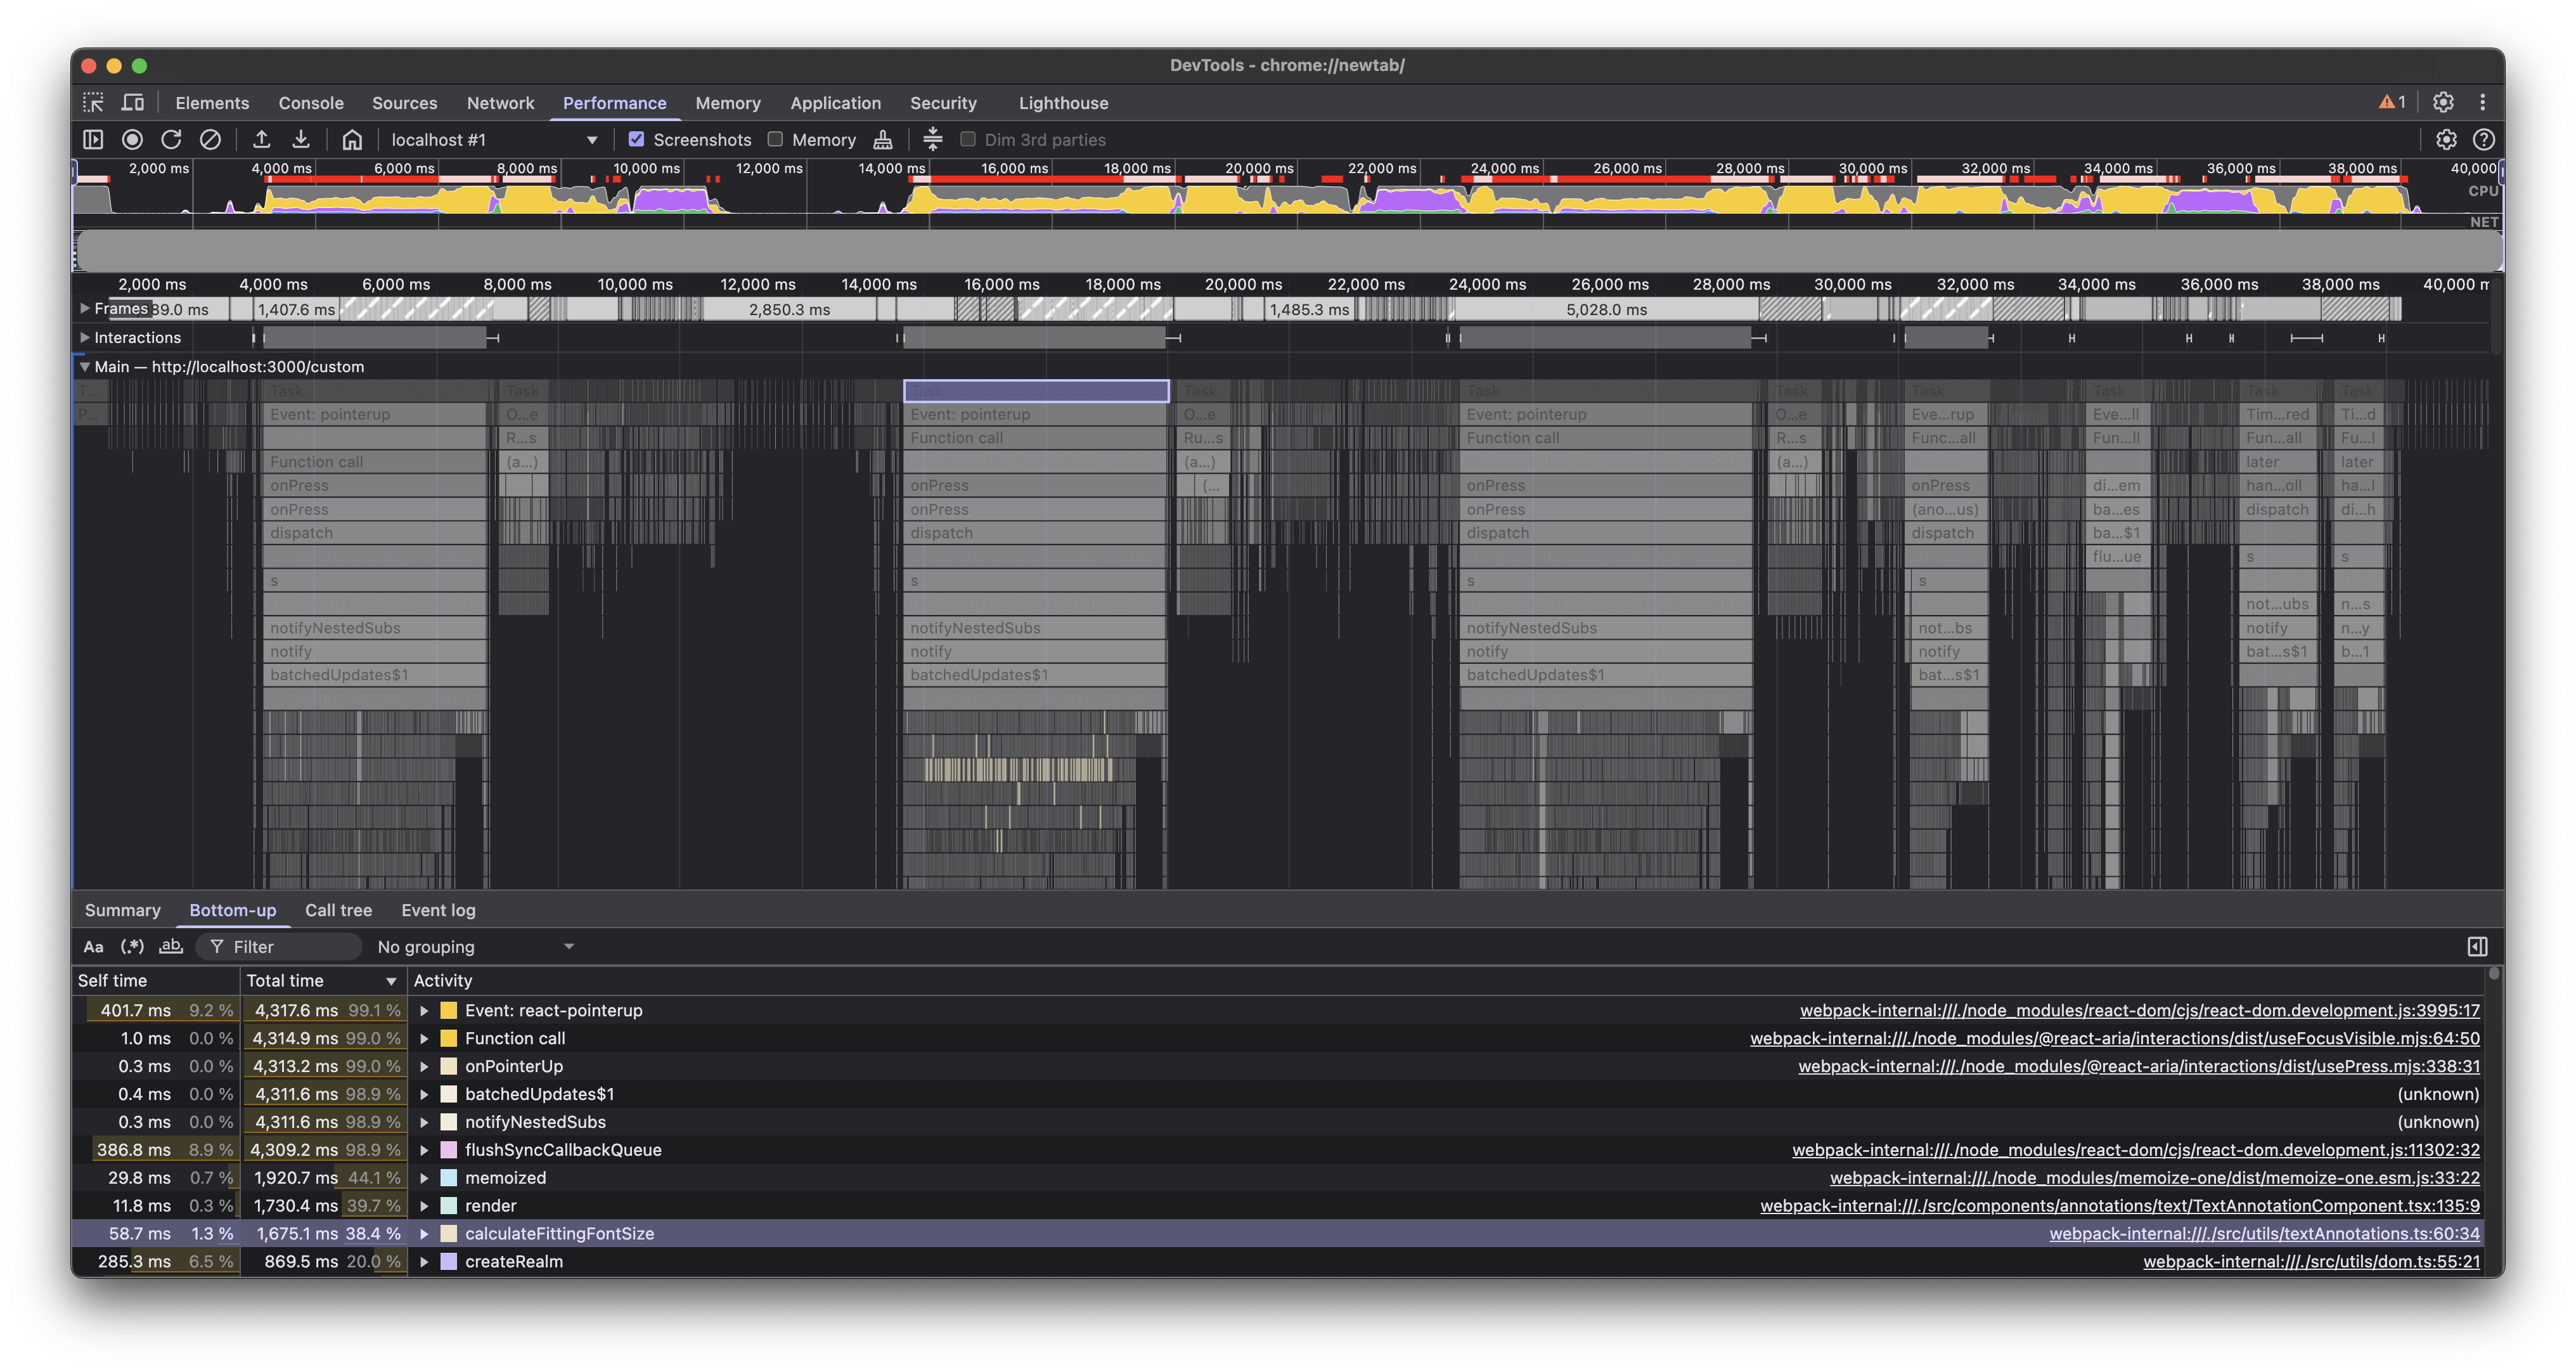
Looking at the source code, we found that we were doing some font calculations in the render cycle(opens in a new tab). This wasn’t expensive for large documents with many annotations, but for our very large test document with thousands of annotations, it was enough to contribute significantly to the main thread blocking time.
The solution was to defer these calculations by moving them from render to componentDidUpdate (yes, we still have a few class-based components). This ensured the component could render first and then do these calculations after the DOM was updated, yielding to the main thread in between, and giving the browser a chance to run more priority tasks, such as handling user interactions.
With hooks, moving these to a useEffect would have been the way to go. We also added a few conditionals to further optimize how often these calculations were done.
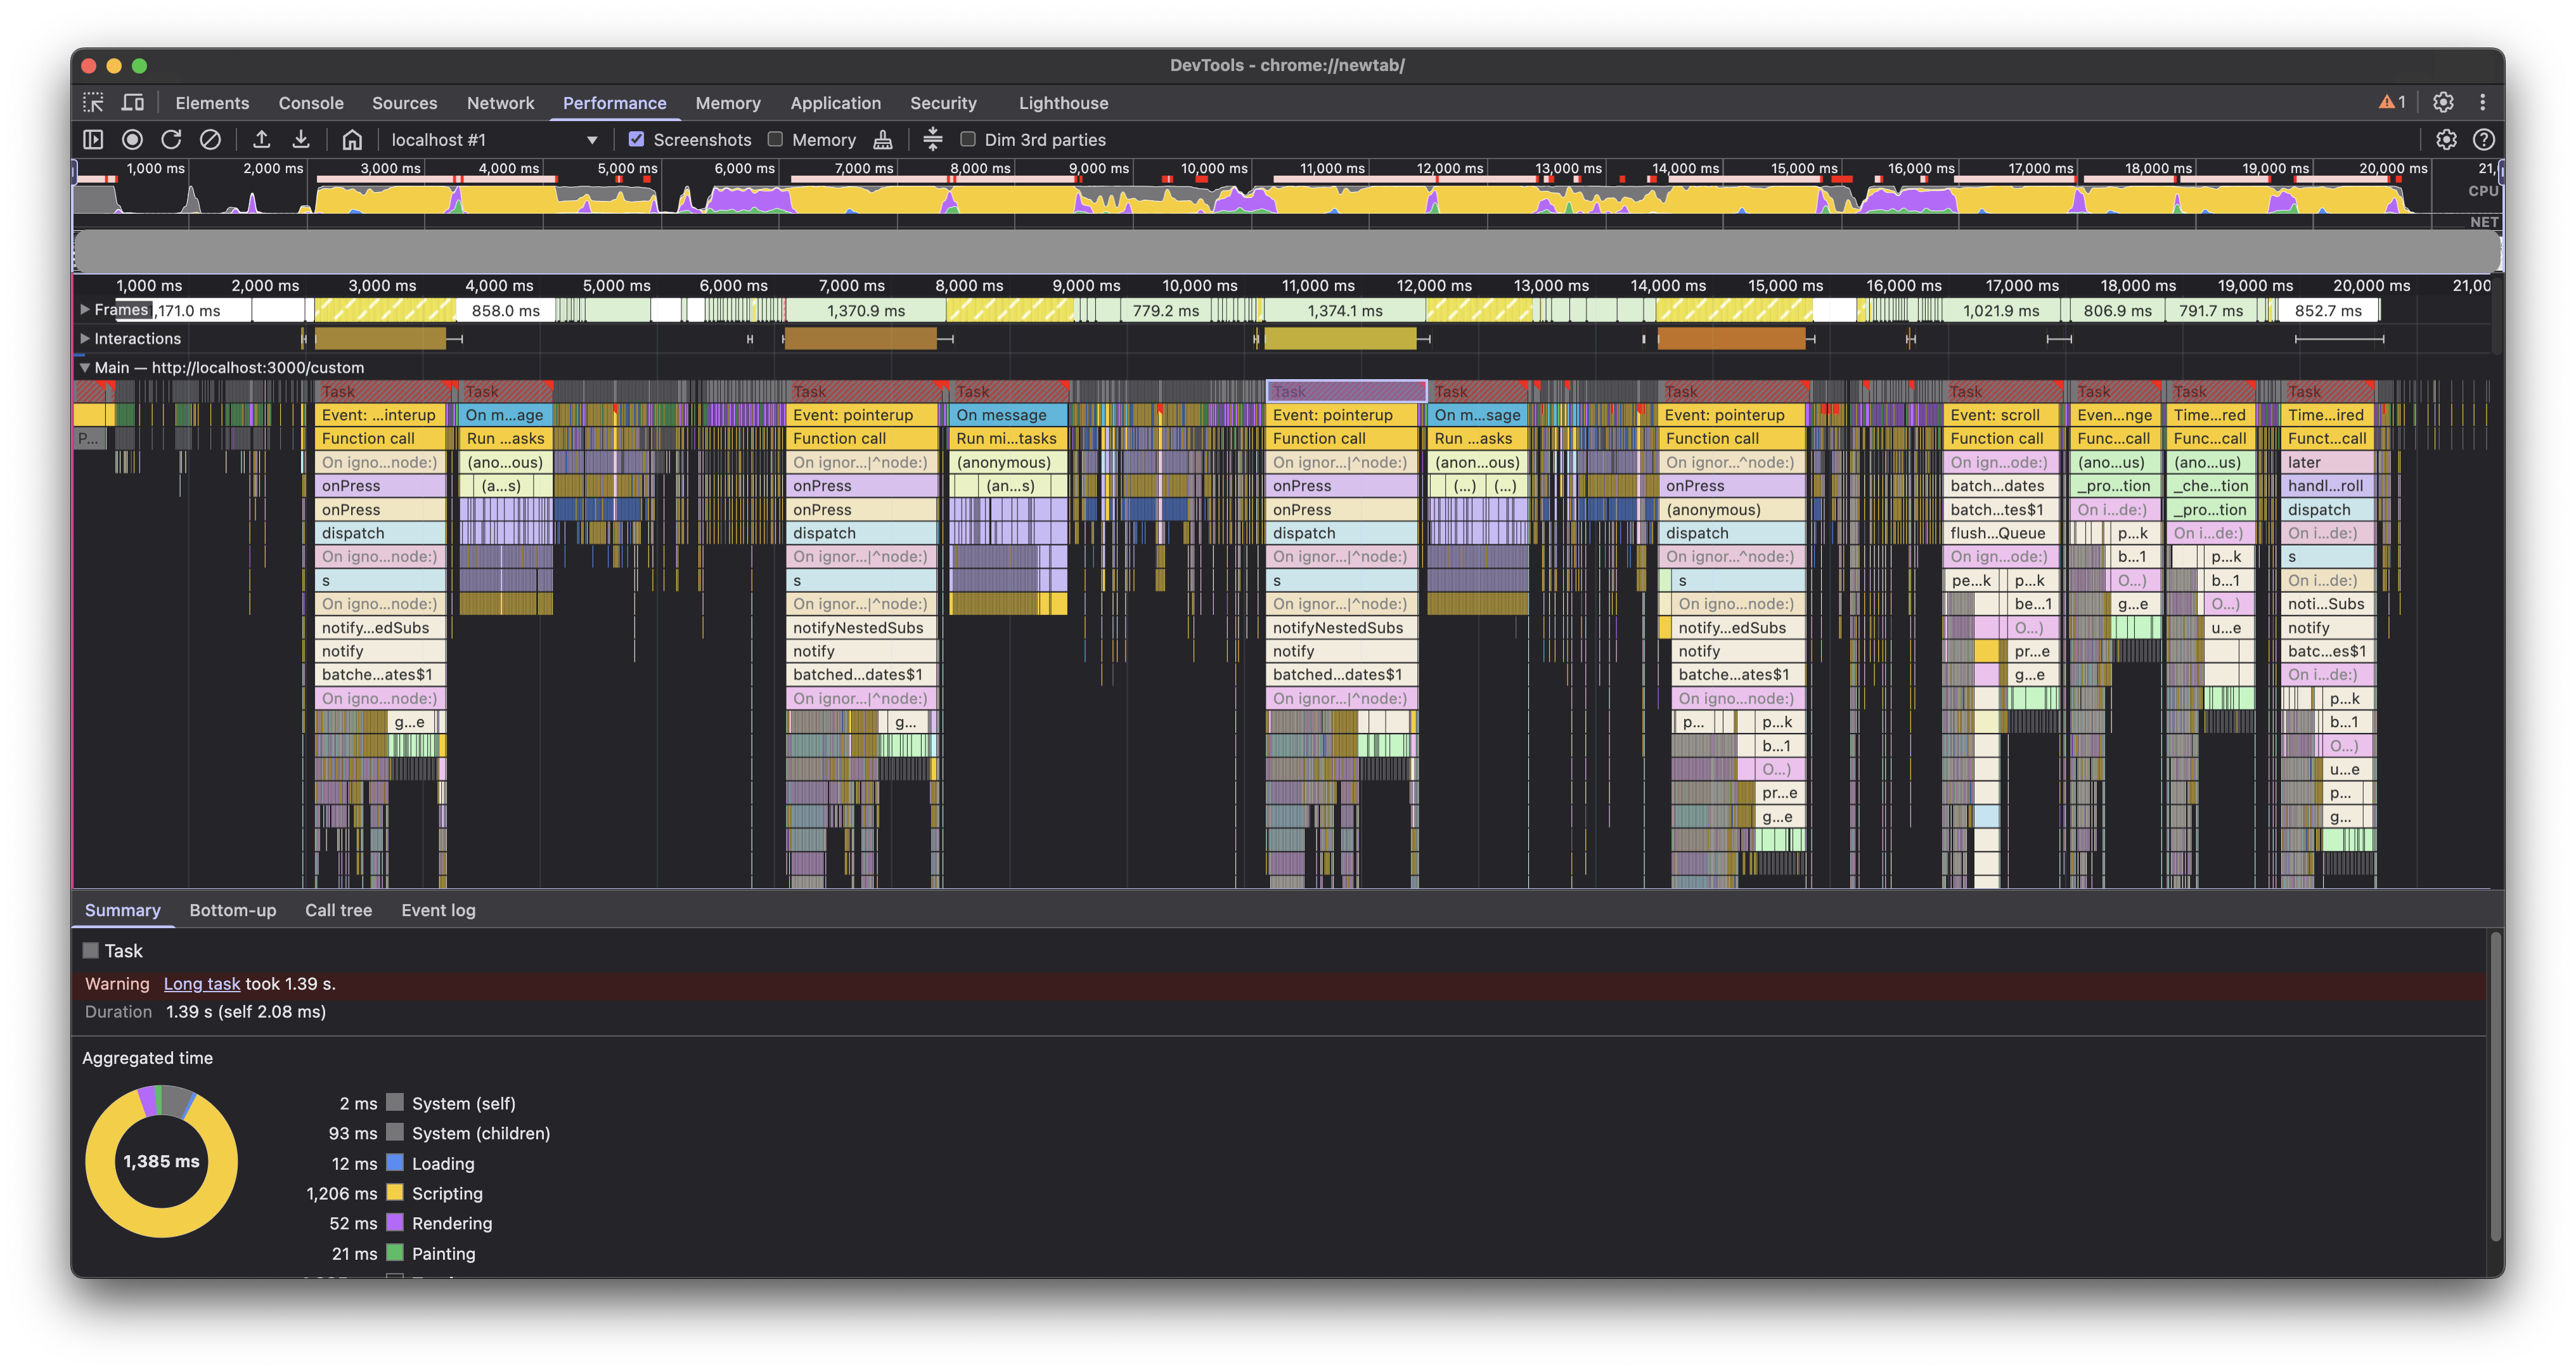
With these in place, the UX became more responsive, but we still had a long way to go. On average, we were able to cut the main thread blocking time by more than half — better than our baseline, but there was still room for improvement. Plus, the queue of microtasks that happened immediately after was still waiting to be debugged.
We identified a few more areas similarly and optimized those as well.
Avoiding shallow copying of very large objects
Another issue we found that was contributing significantly to the lag was a setState call, which looked pretty normal at first glance.
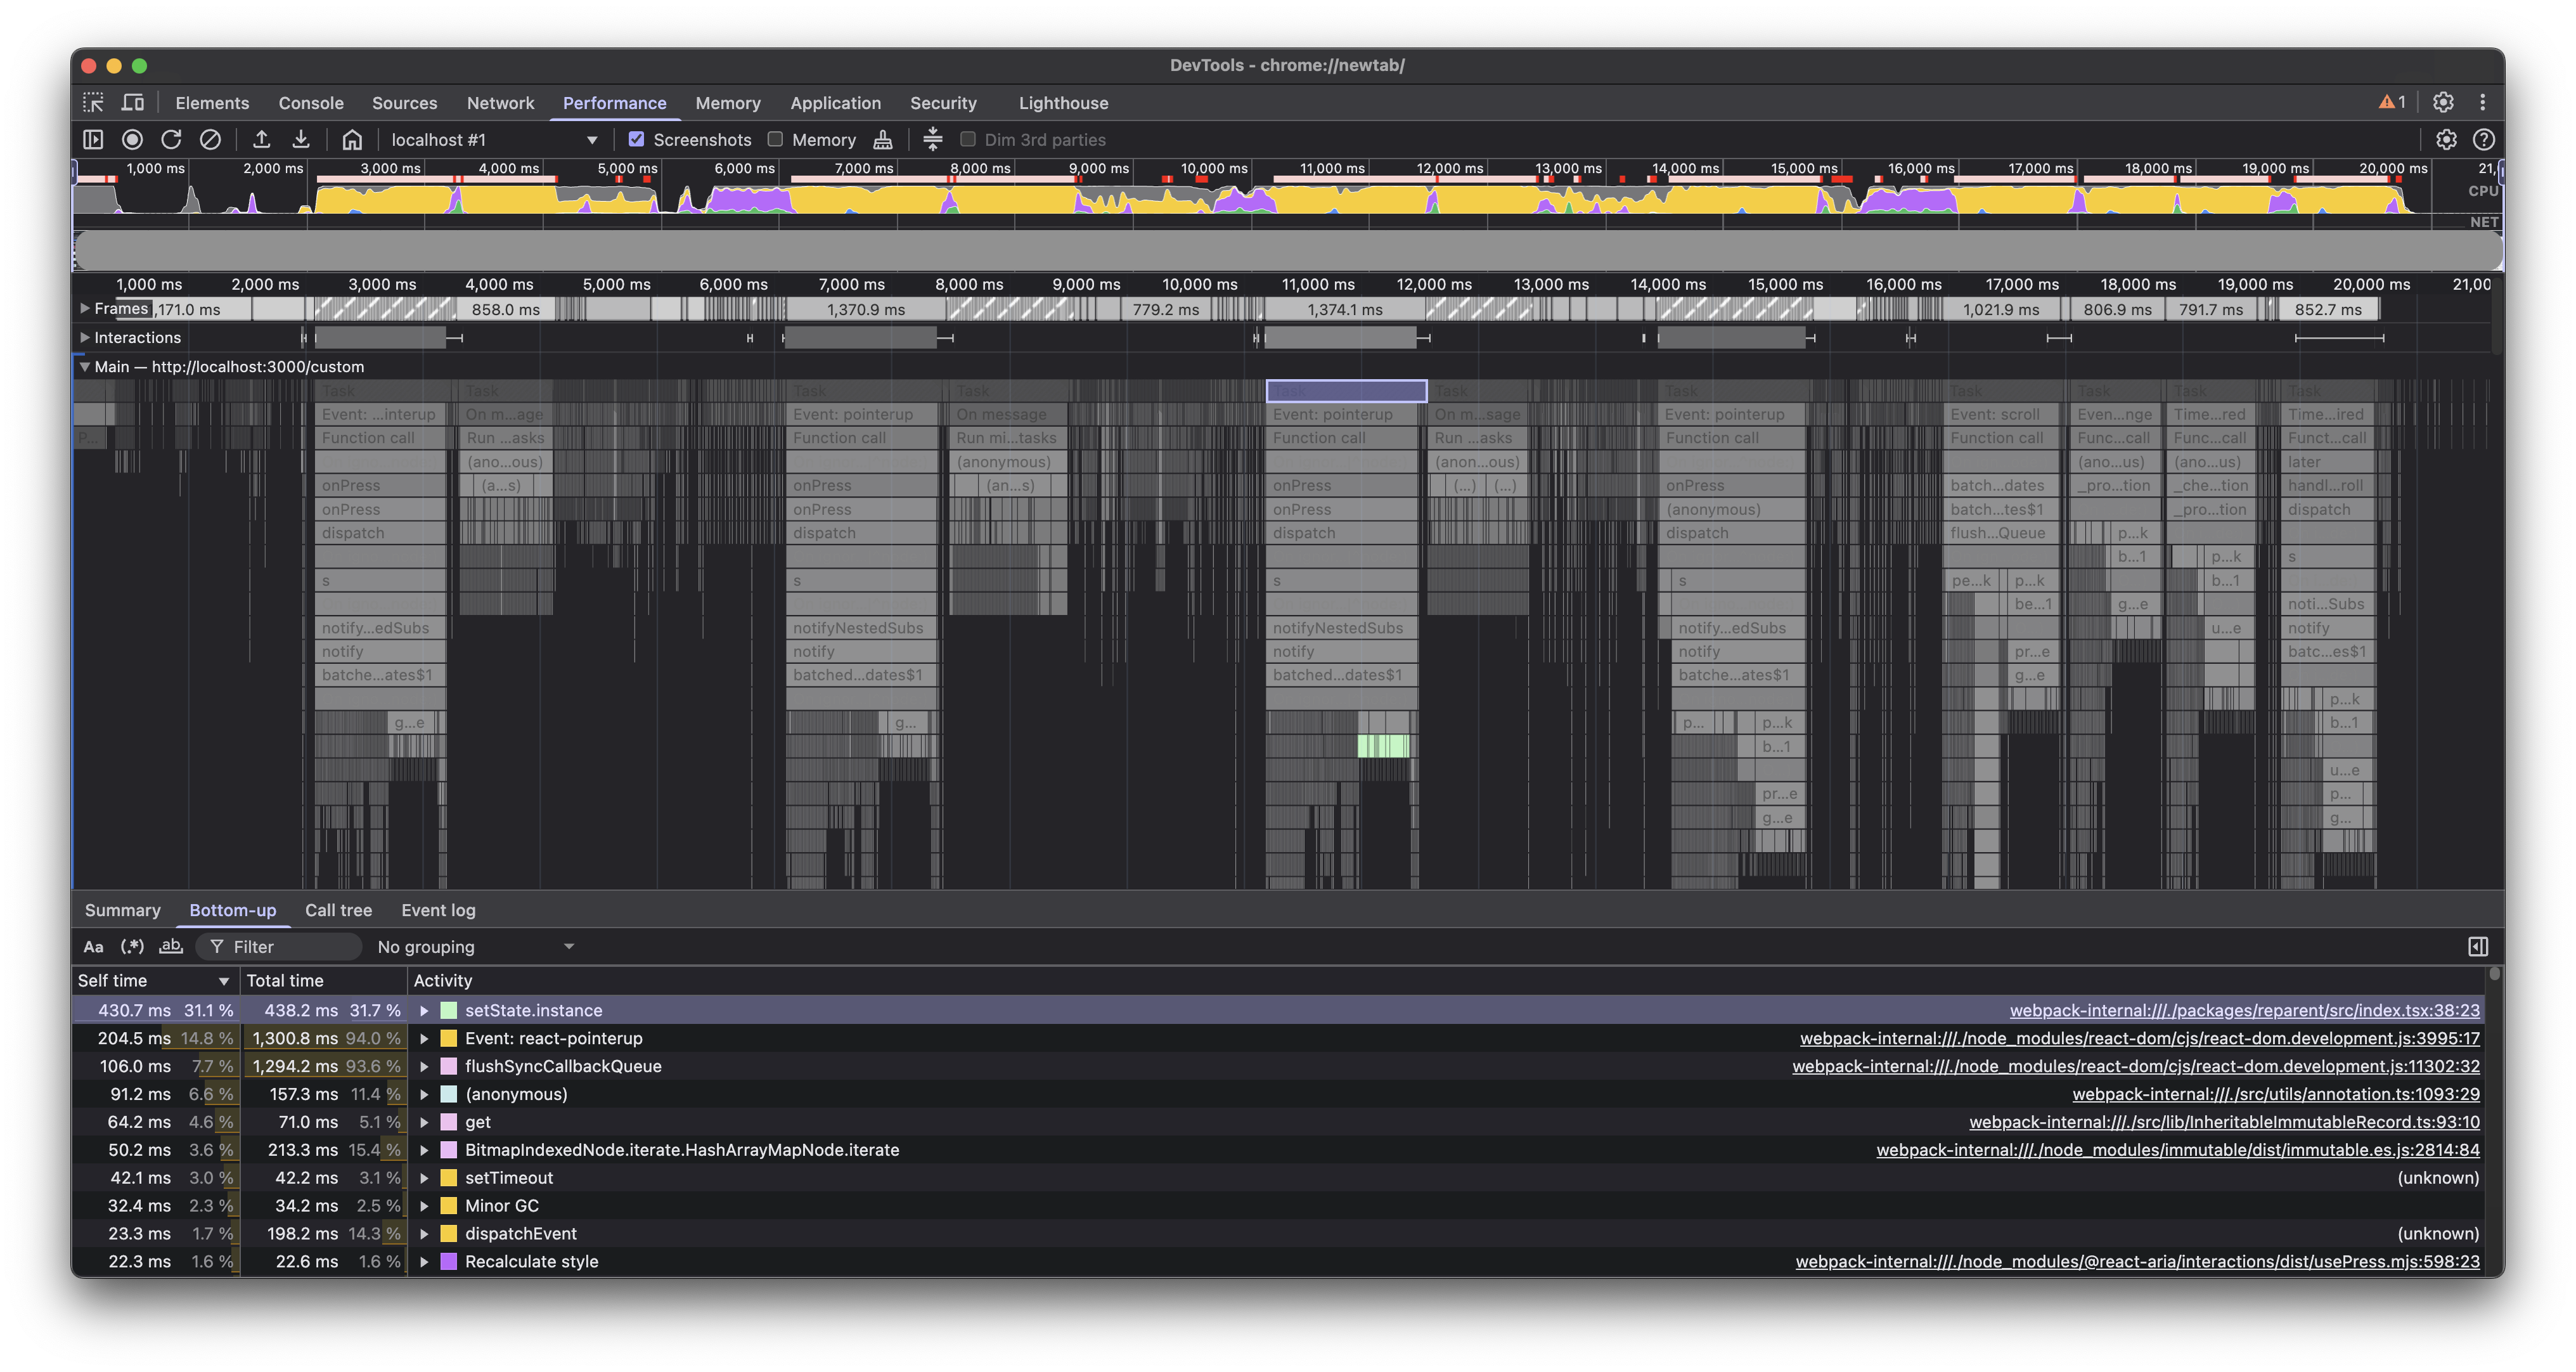
Isolating this further, we narrowed it down to the place where we were updating the state with a new object that was a shallow copy of the previous state. It seemed like the shallow copy operation was taking a lot of time with thousands of annotations in the test document, and optimizing it would give us a significant boost. In case of large objects, shallow copying can cause noticeable performance issues because of the overhead of allocating new memory and copying properties.
This is a common practice in React, which made this less obvious, but as the great detective says:
“When you have eliminated the impossible, whatever remains, however improbable, must be the truth.”
While immutability is the preferred approach in React, we got rid of the shallow copy logic and instead updated the object in place. This was fine here, since we weren’t updating nested properties, and the updated object was immediately passed to setState:
return { instances: { ...instances, [id]: { ...instance, node, target: ref } } instances: Object.assign(instances, { [id]: { ...instance, node, target: ref } })};This change helped us shave off an additional 500 ms from the main thread blocking time.
Memoization
useMemo and useCallback are great tools to optimize performance in React applications. Analyzing the profile revealed a few places where we could benefit from these.
Here’s an example of one such place, which shaved off about 30 ms, but a few more such places can add up to a significant improvement:
const contents = getAnnotationContents(annotation, intl);const contents = React.useMemo( () => getAnnotationContents(annotation, intl), [annotation, intl],);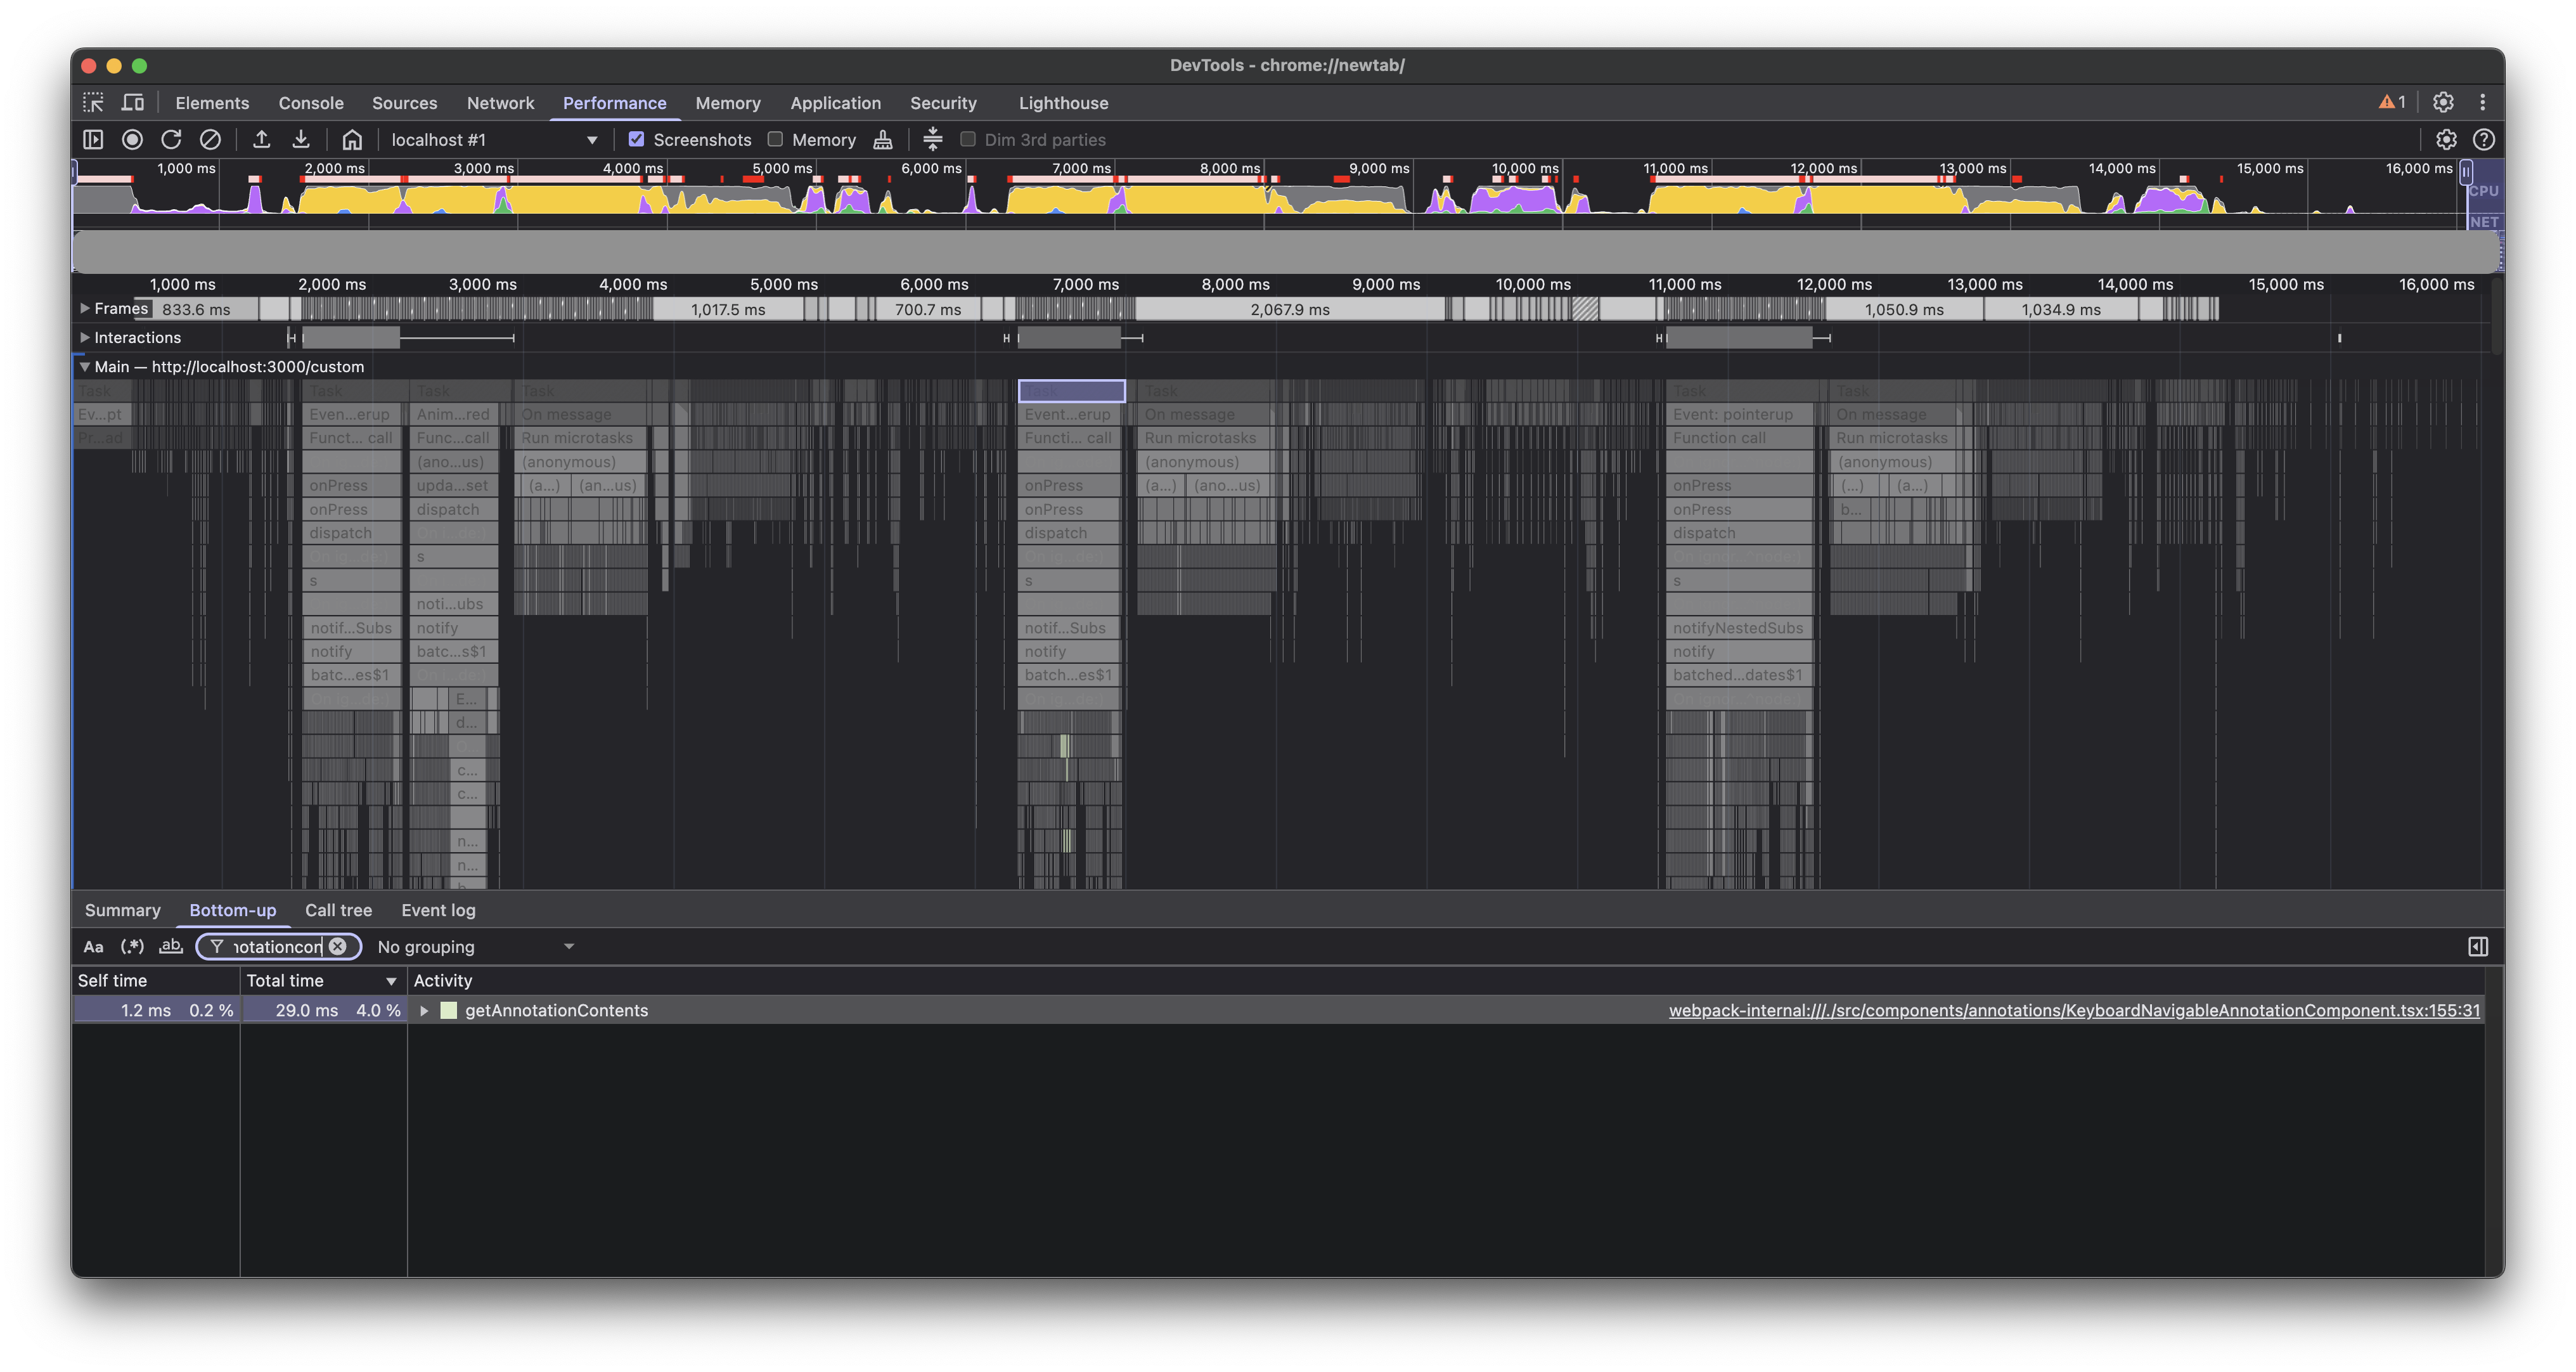
Generally, we should try to avoid premature optimization, but this wasn’t it; this was actual surgical profiling being a very helpful tool in identifying code that can easily benefit with memoization.
Delegate to worker thread
We still had a bulk of microtasks that were blocking the main thread after each zoom operation. These were running some crucial image generations based on zoom recalculations, which were important, but we could afford to delegate running these a bit later. On average, these microtasks were taking about 800 ms to finish.
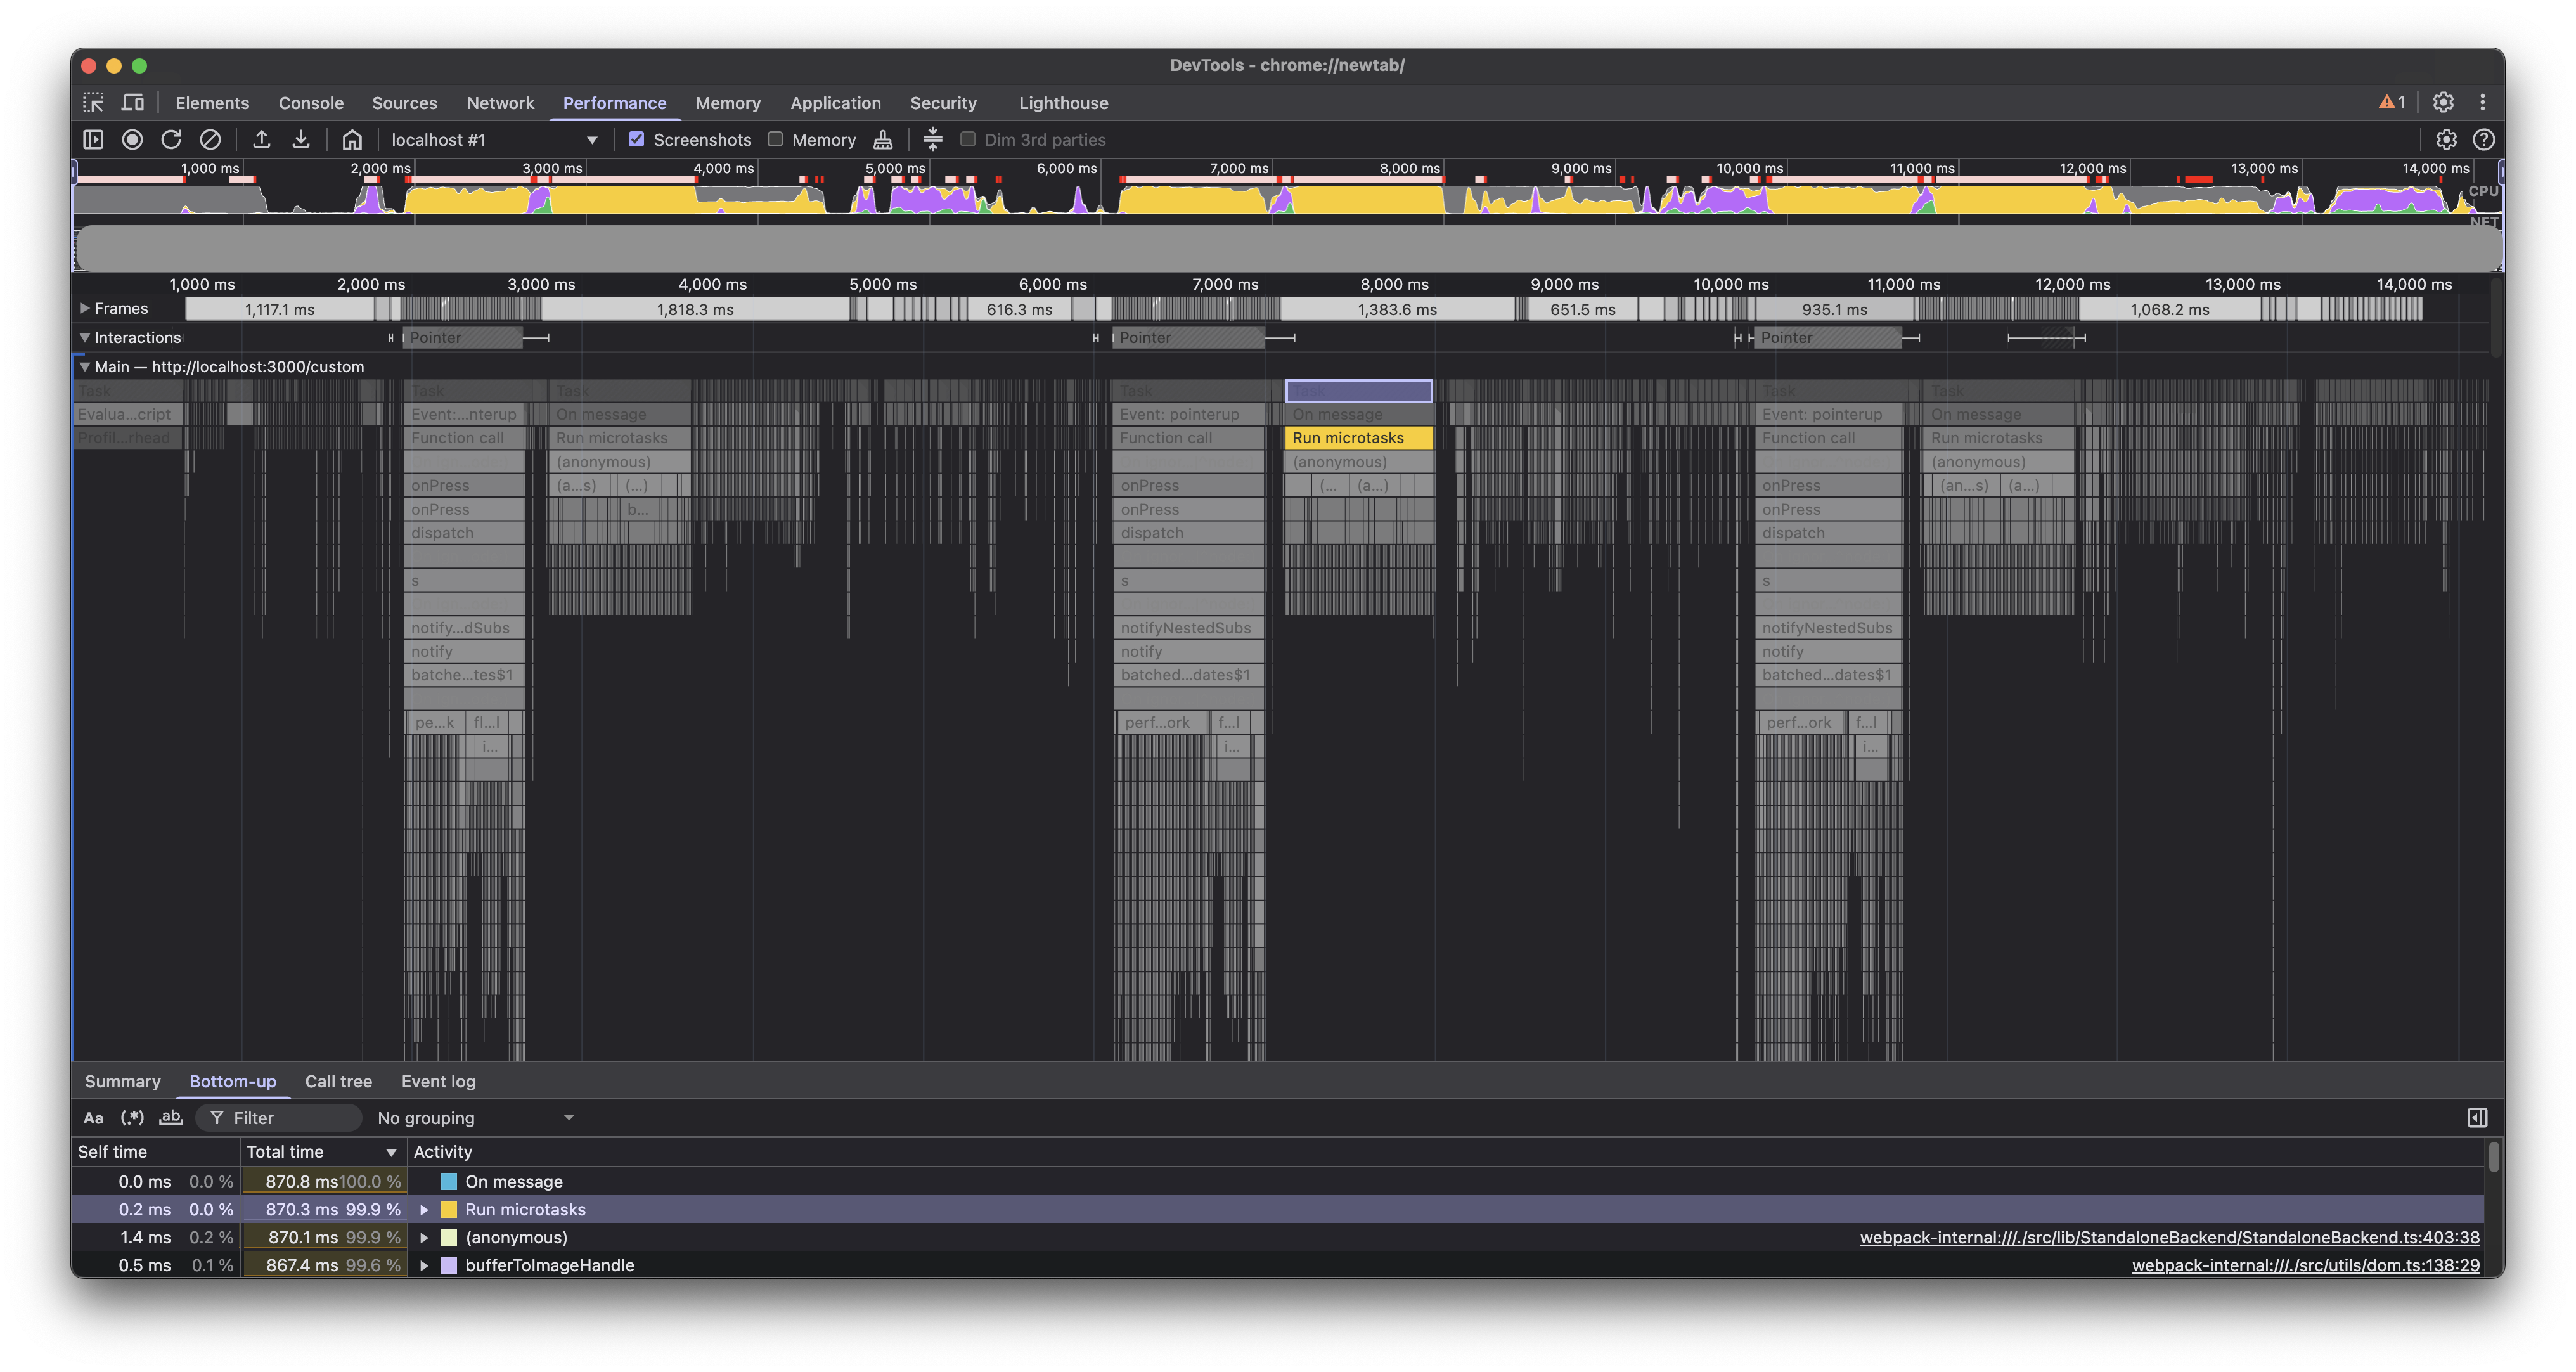
We delegated these tasks to the worker thread(opens in a new tab). Note the tasks running in the worker thread in the profile below.
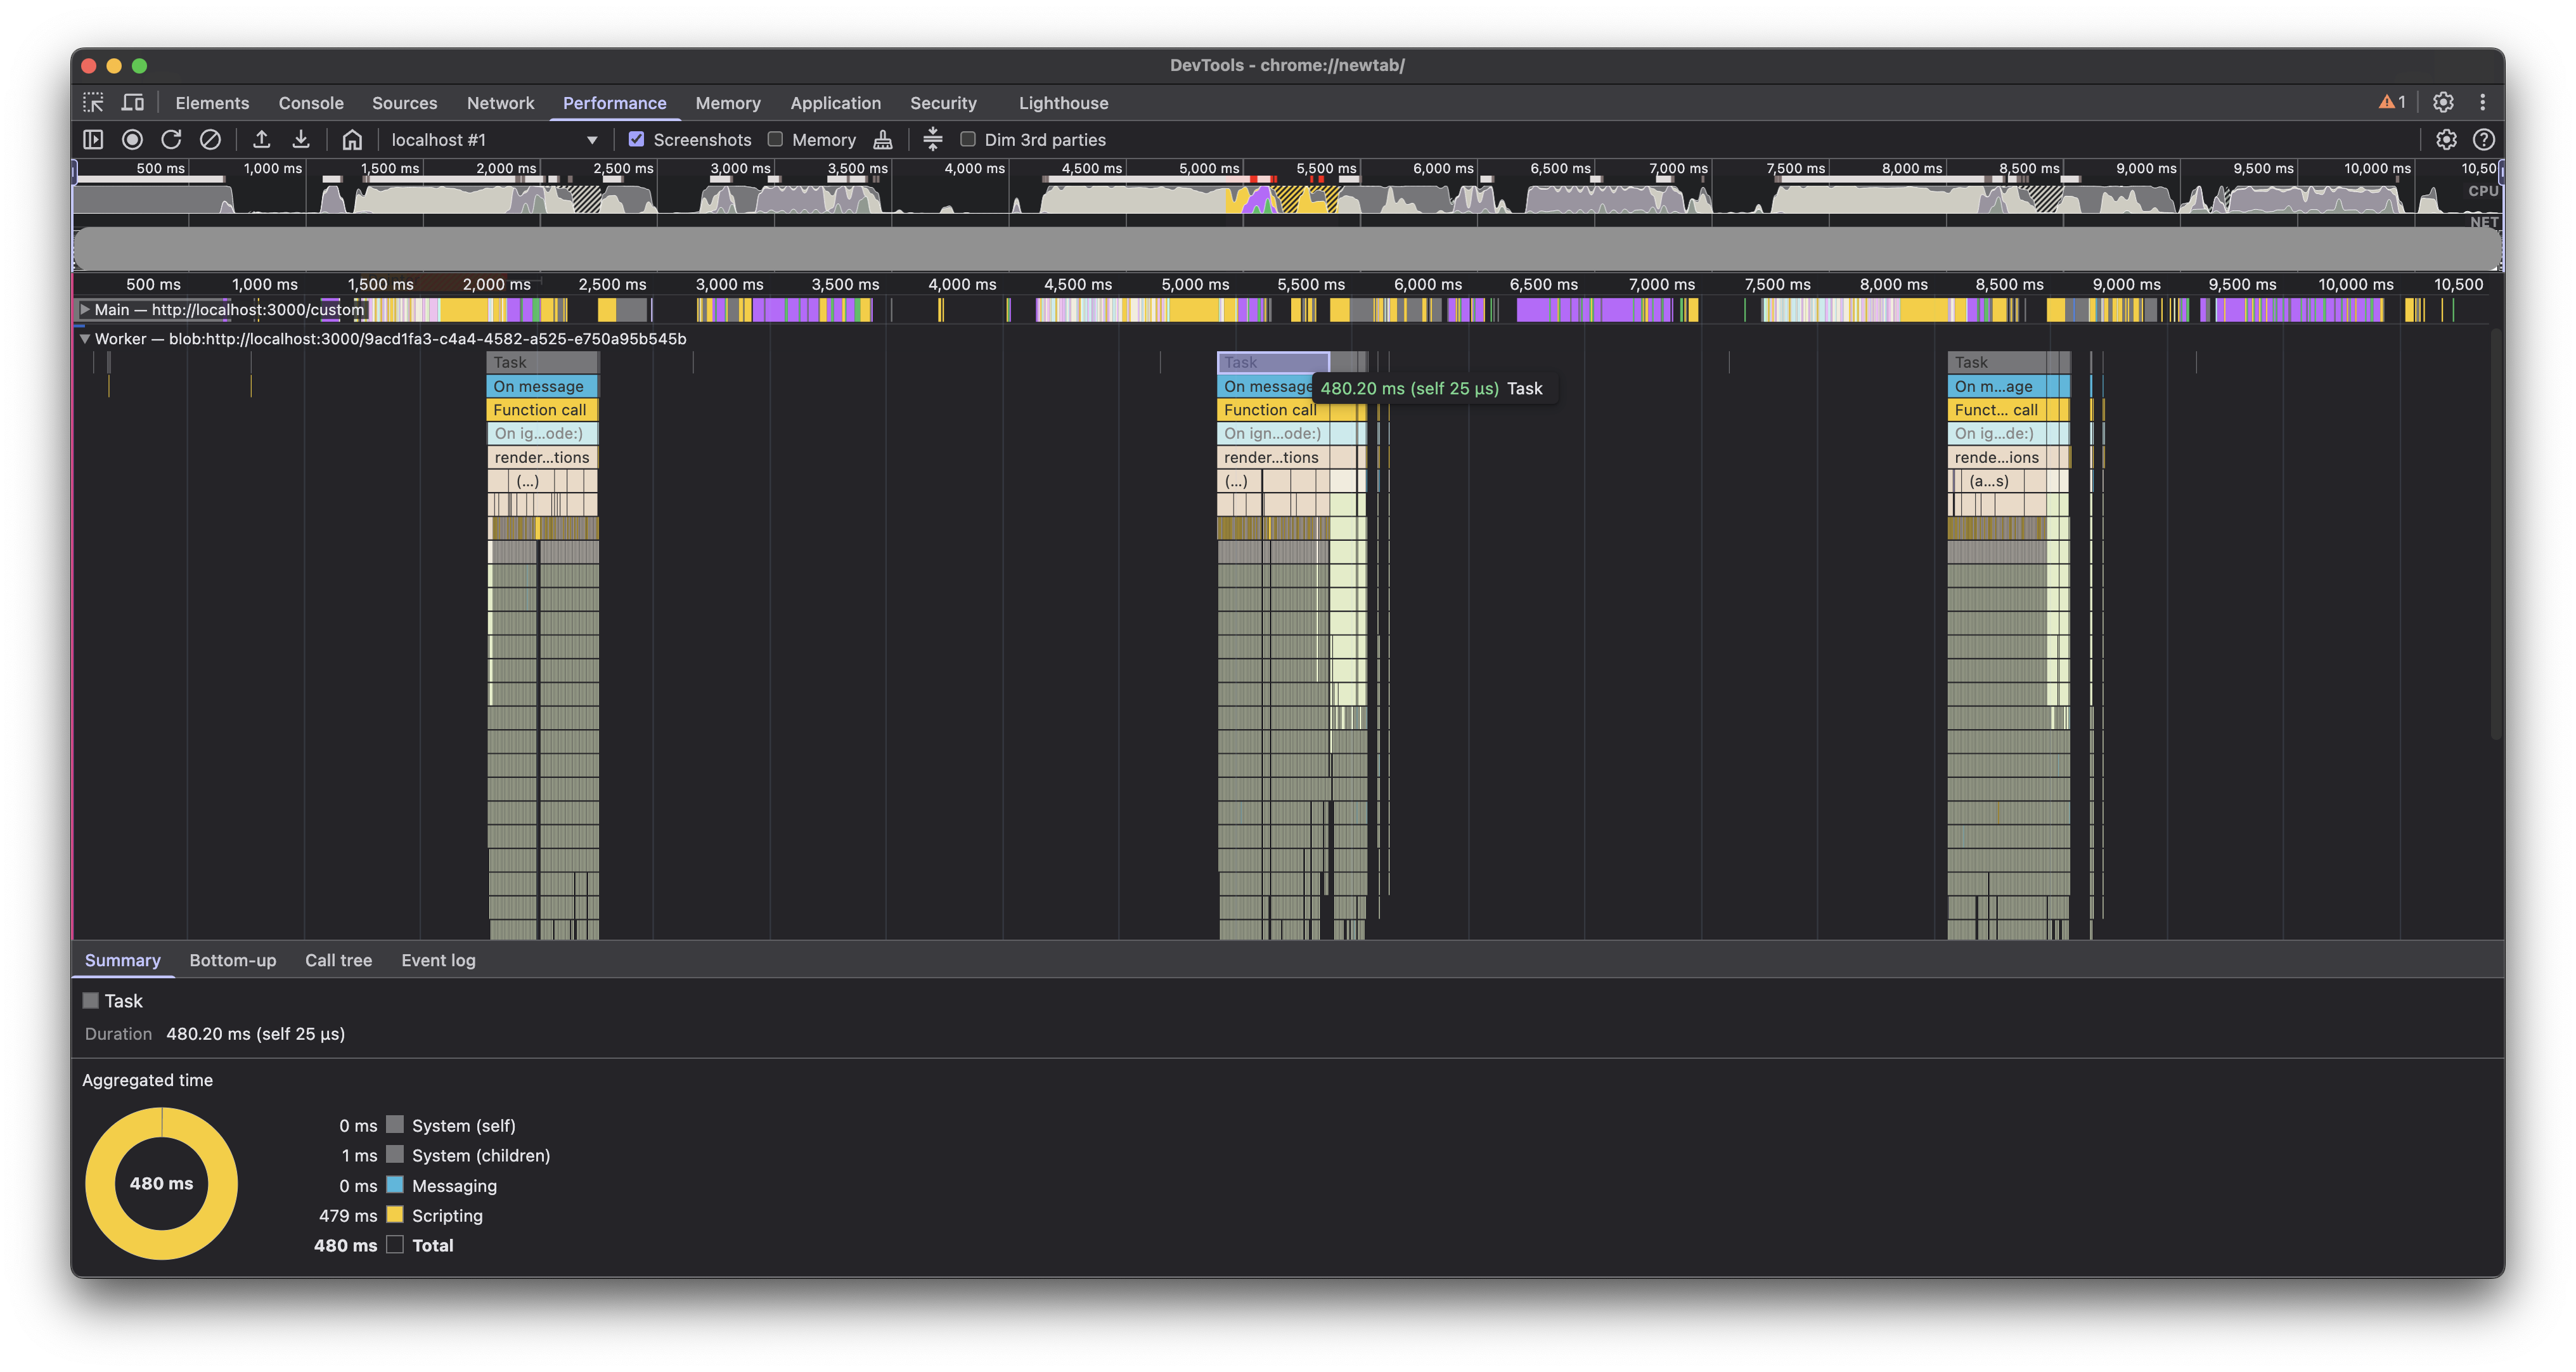
This increased the execution time in the worker thread, but it freed up the main thread much earlier by getting rid of the sequence of microtasks. Overall, it helped us shave off an additional 800 ms of main thread blocking time.
Conclusion
We were able to cut down the average main thread blocking time on our test document from 4.5 seconds to approximately 800 ms. Moreover, the microtasks that were blocking the main thread for about 800 ms were now running in the worker thread, making the UI more responsive.
Although these numbers are still not ideal on our test document, it has made the Web viewer much snappier for all our customers and a majority of documents.
We hope these ideas will be helpful to you in identifying and fixing performance bottlenecks in your React applications.
Next
This was just the first part; we’re not done yet! Part 2 shares how we continued improving these numbers with targeted rerenders and Redux optimization.