Expose Document Engine metrics
Document Engine provides the capability to expose internal metrics for monitoring. Internal metrics offer fine-grained insights into Document Engine performance and help pinpoint specific issues. The list of all exported metrics is available in the metrics reference.
For distributed tracing capabilities, refer to our OpenTelemetry support guide.
Prerequisites
Before you enable metrics export, make sure your Kubernetes cluster includes:
- Prometheus Operator(opens in a new tab) — Required for ServiceMonitor functionality
- Grafana(opens in a new tab) — Required for dashboard visualization (with sidecar(opens in a new tab) enabled for automatic dashboard discovery)
Setting up metrics export
When deploying with Helm, as we recommend, simplified values(opens in a new tab) from the observability.metrics section are available for configuring Prometheus and Grafana integration:
observability: metrics: # Enable Prometheus metrics endpoint prometheusEndpoint: enabled: true # Enable ServiceMonitor for Prometheus Operator serviceMonitor: enabled: true # Enable Grafana Dashboard ConfigMap grafanaDashboard: enabled: truePrometheus endpoint
Enabling observability.metrics.prometheusEndpoint.enabled: true exposes a /metrics endpoint that Prometheus can scrape. This endpoint provides all Document Engine internal metrics in Prometheus format.
ServiceMonitor
Enabling observability.metrics.serviceMonitor.enabled: true creates a ServiceMonitor(opens in a new tab) custom resource for the Prometheus Operator(opens in a new tab). This enables Prometheus to automatically discover and scrape metrics from Document Engine without manual configuration.
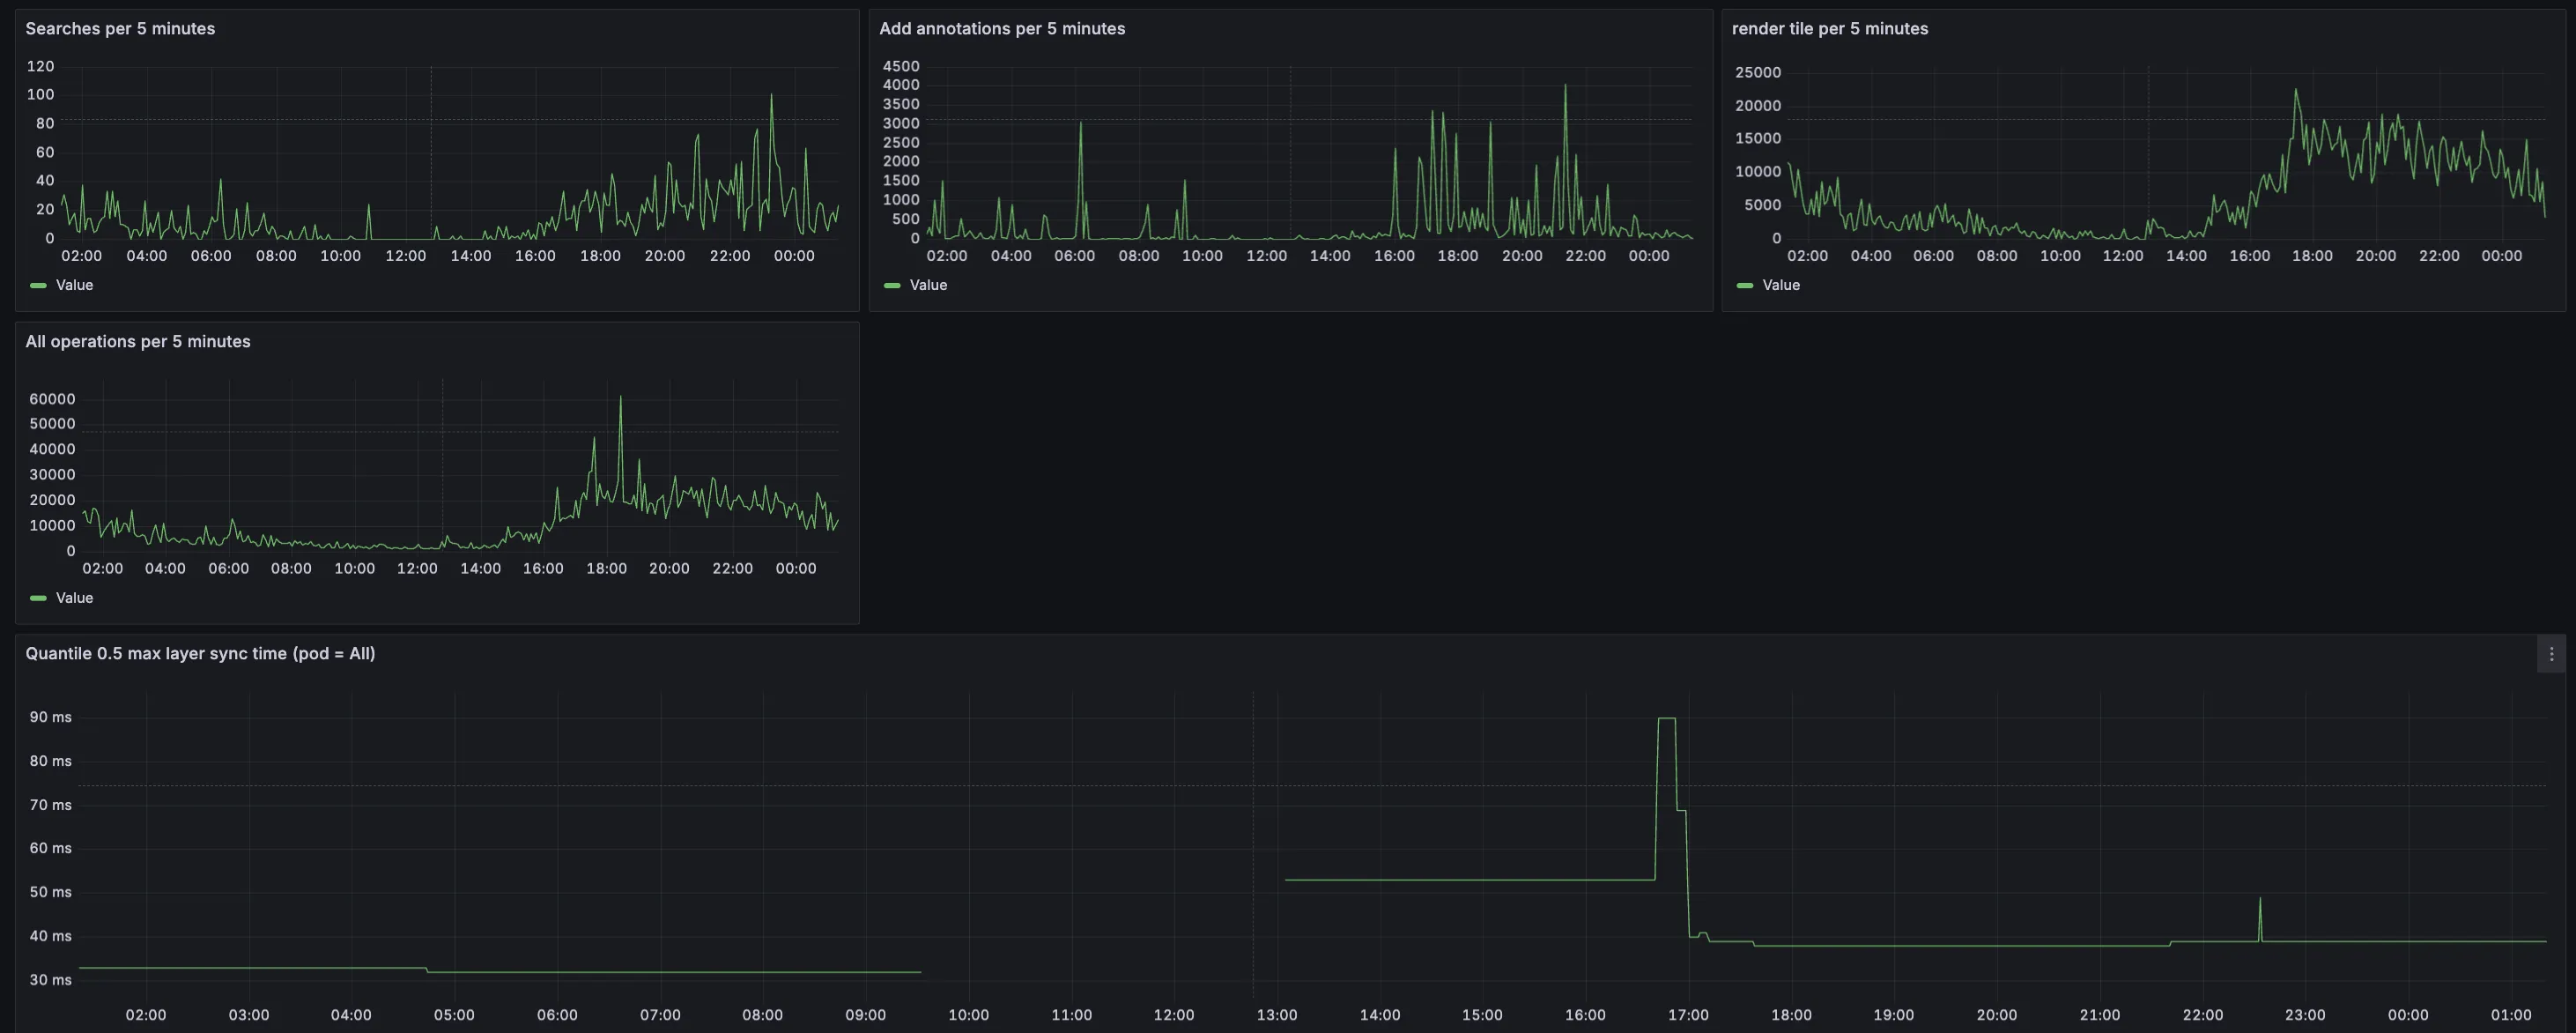
Grafana dashboard
Enabling observability.metrics.grafanaDashboard.enabled: true creates a ConfigMap(opens in a new tab) containing a prebuilt Grafana dashboard for Document Engine metrics. This dashboard is automatically discovered by Grafana if you’re using the Grafana sidecar(opens in a new tab) pattern.
Custom dashboard labels
If your Grafana setup uses different label rules for dashboard discovery, you can customize the ConfigMap labels:
observability: metrics: grafanaDashboard: enabled: true configMap: labels: grafana_dashboard: '1'Adjust the labels map to match your Grafana discovery configuration.
Additional configuration
For advanced configuration options and environment variables, refer to our configuration options guide.