



Why we moved our observability from HyperDX to Dash0


Table of contents
- In 2024, we replaced a fragmented Datadog + Mezmo setup with HyperDX(opens in a new tab). It was OpenTelemetry-native, unified all our signals, and cost about 60 percent less at our volume.
- After ClickHouse acquired HyperDX(opens in a new tab) in March 2025, the cloud product we’d bought into stopped being the priority. In April 2026, our vendor disabled our metrics for nine days during an incident and never told us.
- We moved to Dash0(opens in a new tab), another OpenTelemetry-native platform, with mere hours of migration work. The full move took about six weeks from decision to closing the HyperDX account. Instrumentation didn’t change; collector endpoints did.
- Our takeaway: Standardize on OpenTelemetry(opens in a new tab) and treat the backend as replaceable.
In April 2026, our observability vendor switched off part of our telemetry and didn’t tell us. We noticed nine days later, and only because our dashboards looked suspiciously calm. We saw no email, status-page notice, or in-app banner. When we asked, support confirmed our metrics had been “temporarily disabled for some users” during an incident on its side. Two months later, we closed the account.
This post covers the two years before that. We chose HyperDX in 2024, a decision we’d make again with the same information. The relationship then eroded after the ClickHouse acquisition, and moving to Dash0 took hours of work instead of weeks. OpenTelemetry (OTel) is the open standard that kept our telemetry portable and made the vendor swap mostly a configuration change.
The bet: OpenTelemetry first, vendor second
In early 2024, our observability was fragmented. Logs lived in Mezmo, metrics were in Datadog, and distributed tracing existed mostly in aspiration. That meant three signals across two vendors with no correlation between them, plus two bills growing faster than our patience.
Before we evaluated a single replacement, we made an architectural decision: We’d instrument everything with OpenTelemetry and route every signal through OpenTelemetry Collectors(opens in a new tab) that we run ourselves. Applications and infrastructure speak OpenTelemetry Protocol (OTLP(opens in a new tab)) to a local collector; the collector decides where the data goes.
That gave us three properties we cared about:
- Instrument once — OTel SDKs and auto-instrumentation are vendor-neutral. The only vendor-specific piece in the entire pipeline is the exporter block in the collector configuration.
- Process on our side — Sampling, filtering, and attribute cleanup happen in collectors we control, not in a vendor’s ingestion pipeline. Noise reduction shouldn’t require a support ticket.
- An exit, by design — If the backend ever needs to change, the change is confined to configuration we already manage with Terraform.
Our working assumption was that most observability vendors are converging on a query UI over a columnar store filled by OpenTelemetry. If that’s true, the lock-in isn’t in our instrumentation but in our dashboards, saved queries, and alert definitions. That’s why we kept those as code too, templated and version-controlled, from day one.
Why we chose HyperDX in 2024
The OTel foundation narrowed the shortlist to OpenTelemetry-native platforms. In mid-2024, that primarily meant HyperDX and SigNoz(opens in a new tab), both built on ClickHouse and both with open source cores.
| Datadog + Mezmo (incumbent) | SigNoz | HyperDX | |
|---|---|---|---|
| All signals in one place | No — logs and metrics in separate products | Yes | Yes |
| OpenTelemetry-native | OTel ingestion supported; agent-first product | Yes | Yes |
| Open source core (self-host escape hatch) | No | Yes | Yes |
| Cost at our volume (modeled) | Baseline | Lower | About 60 percent below baseline |
| Day-to-day search and UX | Mature, split across two UIs | Capable | The one our on-call engineers preferred |
HyperDX won on the things we felt every day: search-first workflows, predictable per-event pricing, and an API that let us generate dashboards from Terraform. The open source version was our fallback. If the company vanished, we could self-host the same stack.
Support that shipped features overnight
Early HyperDX gave us the best vendor support we’d ever had. Our support history from 2024 reads like a changelog:
- We asked whether dashboards could be cloned from the UI, and HyperDX shipped it the next day.
- We asked for a surrounding-context view on log lines, and HyperDX shipped it the same evening, with a follow-up custom-filter feature the next morning.
- We hit a bug assigning user groups on invites, and HyperDX fixed it the same day and posted a workaround in the meantime.
- We accidentally flooded the platform with roughly 300,000 events per second. HyperDX noticed before we did and pinged us to help avoid a surprise bill.
- We asked detailed questions about metrics billing, and a founder walked us through the data-point math until our spreadsheet matched HyperDX’s.
These were founders answering, often within the hour, and frequently turning feedback into deployed features in less than 24 hours. That responsiveness papered over the usual early-product rough edges. Alert evaluation ignored dashboard-level filters, and the product auto-elevated JSON log fields into attributes that could collide with OTel resource attributes. Similar quirks followed, and we reported them. Many got fixed quickly.
The tradeoffs we accepted
HyperDX had no SOC 2 report at the time and processed data exclusively in the United States. It also offered only soft billing limits because hard caps weren’t implemented yet. We accepted those gaps consciously, with the open source self-hosting option as the fallback if compliance requirements caught up with us.
What changed after the acquisition
In March 2025, ClickHouse acquired HyperDX(opens in a new tab). The announcement promised acceleration without disruption. We had no reason to doubt it, because ClickHouse was already the database underneath the product we liked.
The change was gradual. Over the following year, the center of gravity moved to ClickStack, the bundled ClickHouse observability distribution. Development on the cloud product we were paying for slowed, and API inconsistencies lingered. In one, the dashboards API returned different fields than it accepted, which quietly broke our Terraform-managed dashboards on a provider upgrade. And the founders who used to ship our feature requests overnight were, understandably, busy with bigger things. Support stayed polite but became increasingly absent.
None of that was fatal on its own. A working system with slowing feature velocity is still a working system, and migrations have real costs, so we stayed.
April 2026: The silent switch-off
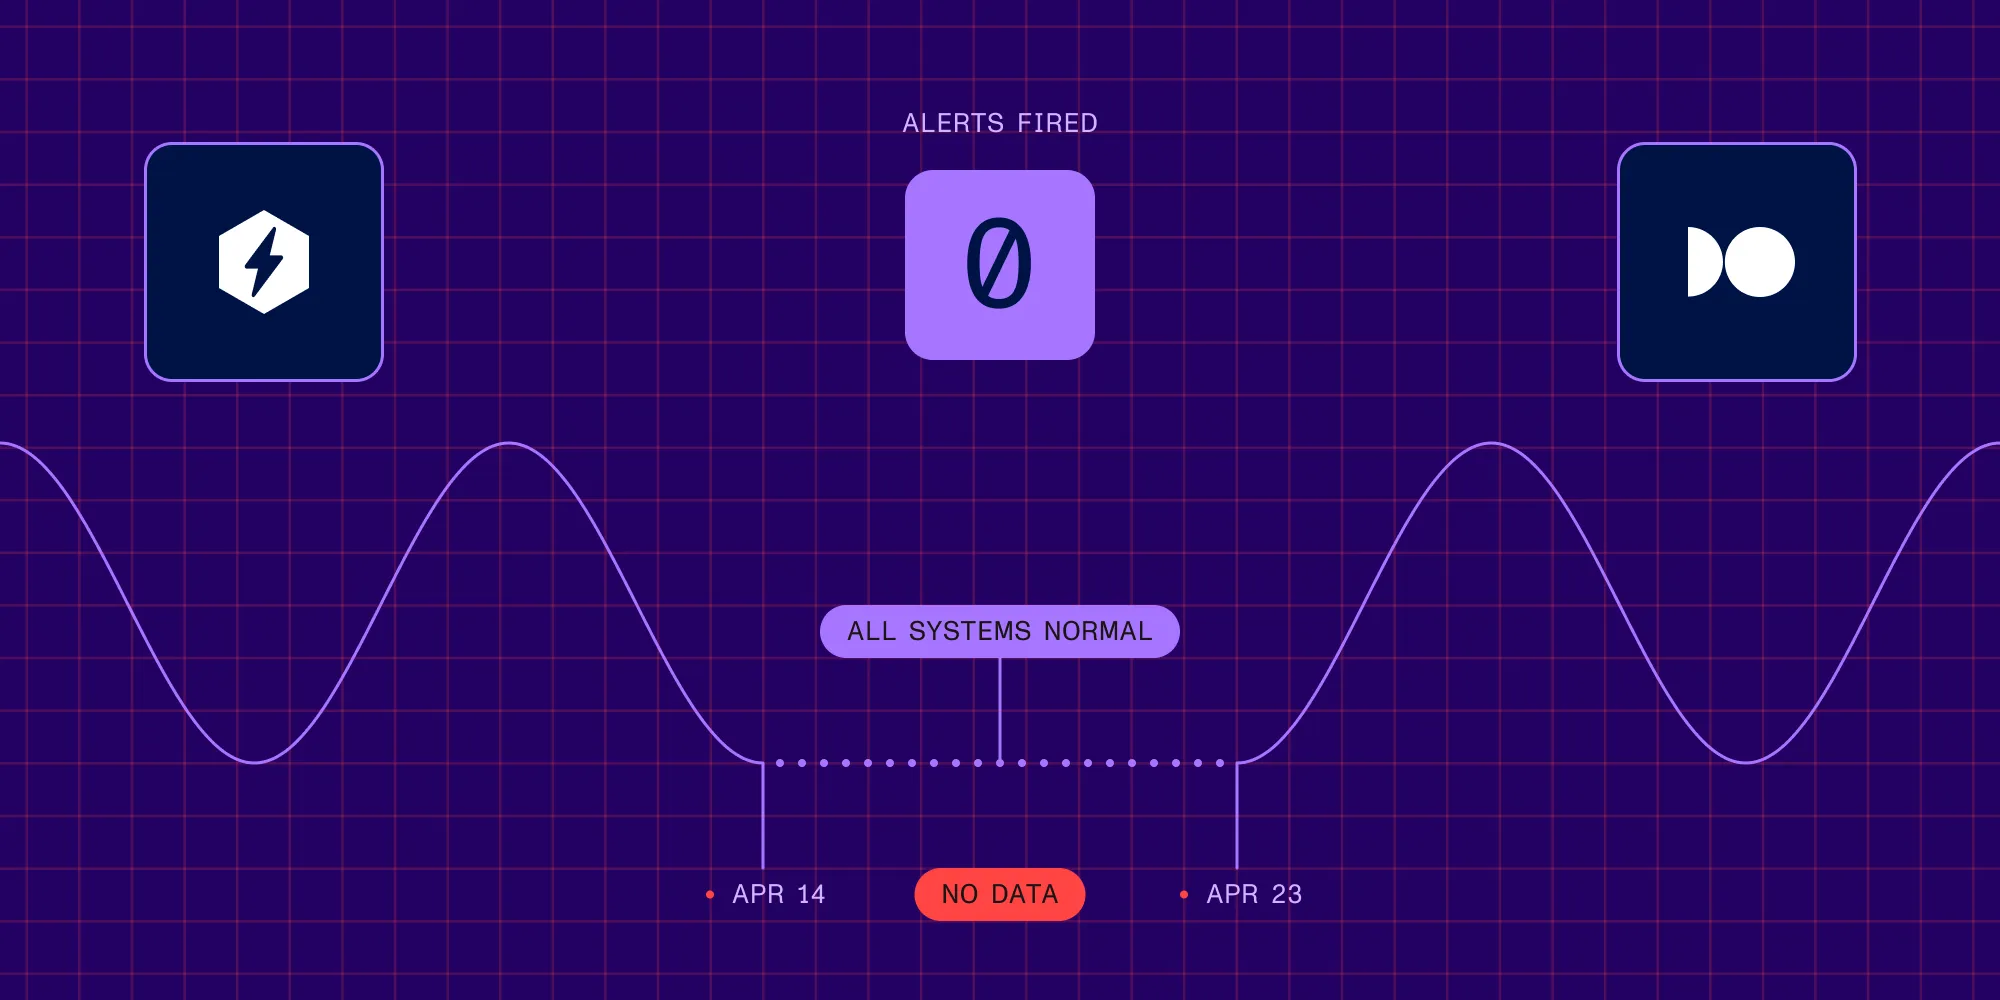
On 14 April 2026, our metrics ingestion dropped to near zero. Nothing had changed on our side: no deploys, no collector updates, and no configuration drift. We noticed on 23 April and asked support whether something had changed.
Support told us there had been an incident the previous week and that metrics had been “temporarily disabled for some users.” Ours, it turned out, were among them. They were reenabled when we asked, but then dropped again hours later, before eventually stabilizing.
For nine days, a monitoring vendor had our metrics switched off, and the only reason we found out was that we went looking. We couldn’t find any notification: no email, and no status-page entry that matched. When we asked, directly, where the vendor had sent the incident communication, the question went unanswered.
Losing metrics silently is worse than a clear outage. Alerts built on those metrics can’t fire on data that doesn’t arrive, and absence of data looks exactly like absence of problems. For nine days, everything looked healthier than it was.
For an observability vendor, incident communication is part of the product itself. An observability platform you have to monitor yourself is a contradiction in terms.
We decided to leave the next day, and the evaluation that followed focused on where to go.
Why Dash0
Our 2026 requirements looked like the 2024 list, plus everything we’d learned to price in: compliance posture, data residency, incident communication, and company trajectory. You can’t read that last one off a pricing page.
We considered five options: staying on the renamed ClickStack offering, self-hosting, Grafana Cloud, Axiom(opens in a new tab), and Dash0(opens in a new tab). Self-hosting lost because running an observability stack is its own on-call rotation, and we’d rather spend that time on product infrastructure. Grafana Cloud lost on cost, at multiples of the alternatives at our volume. Axiom made the shortlist; Dash0 won.
OpenTelemetry-native, end to end
Dash0 takes OTLP in, understands OTel semantic conventions natively, and uses no proprietary agents. That’s exactly the shape of data our collectors already produce, so it was close to a drop-in replacement.
Compliance and residency
Dash0 has a SOC 2 Type 2 report and hosts data in the European Union (EU) on Amazon Web Services (AWS). Both were gaps we’d consciously accepted in 2024, and we didn’t want to accept them twice.
Predictable pricing
Dash0’s per-signal pricing is transparent, and it stayed well below the alternatives we modeled, even when we stress-tested the model at double our current volume.
Trajectory
Dash0 was founded in 2023 by the team behind Instana and built OTel-native from the first commit. It has a Terraform provider and dashboards-as-code support. During evaluation, its team answered quickly and substantively, the way HyperDX’s did in 2024.
We didn’t leave ClickHouse; Dash0 is also built on it. We left a product whose roadmap had moved away from us and an operational relationship that had stopped working.
How the migration actually went
This is where the 2024 bet paid out. Every workload we run already emitted OTLP to a local OpenTelemetry Collector. That covers Kubernetes clusters for our managed cloud, the Amazon Elastic Container Service (ECS) services behind this website, the content delivery network (CDN) layer, and continuous integration (CI) build agents. Switching vendors meant changing the exporter endpoint and credentials in collector configuration, rolled out through Terraform and GitOps, environment by environment. We redeployed no application for the migration. By volume, we were moving terabytes of events and hundreds of millions of metric data points per month. By diff, it was a handful of configuration changes.
OpenTelemetry didn’t cover three things:
- Dashboards had to be rebuilt. OTLP makes the data portable; it does nothing for saved queries and chart definitions. Terraform templates generated our HyperDX dashboards, so porting them was translation work, but it was still work.
- Alert rules were recreated and retuned, including thresholds that had quietly calibrated themselves to one vendor’s evaluation behavior.
- Query-language muscle memory reset. On-call engineers had to relearn search syntax and query habits. There’s no configuration file for that.
Here’s the timeline. We decided to leave on 24 April and ran the evaluation and compliance review over the following weeks. The first services shipped telemetry to Dash0 by mid-May, and we closed the HyperDX account on 9 June. That was about six weeks from decision to closed account, in part because higher-priority work came first, but the migration work itself took hours. The expensive step was adopting OpenTelemetry in the first place, and we paid for it once, in 2024. Migrations after that are configuration changes.
What we learned
- Standards outlive vendors — Instrument against OpenTelemetry, not against whoever currently stores the data. Two years and two vendors later, our instrumentation hasn’t changed.
- Design portability in from the start — Local collectors in front of every workload are what made the exit cheap. We built that layer early, assuming we’d eventually use it.
- Dashboards and alerts are the real lock-in — Keep them as code. Our Terraform-managed dashboards turned the stickiest part of the migration into a porting exercise.
- Evaluate trajectory as well as the product — The HyperDX we signed with in 2024 was excellent. Acquisitions change priorities, and customer experience is often where the change shows first.
- Incident communication is part of the product — A vendor that doesn’t tell you when your telemetry is off has misunderstood what it’s selling.
- Cheap exits change the relationship — When leaving costs a configuration change, you never feel stuck. That’s worth designing for before you need it.
What’s next
We’re consolidating on Dash0: dashboards-as-code for everything, deeper alerting integration, and steadily wider tracing. So far, it has been what we hoped HyperDX would remain.
If the industry surprises us again, the collectors are ready.
If infrastructure retrospectives are your thing, we’ve written a couple:
- Modernizing CI build servers: How to migrate from Chef to Ansible
- Emerging threats: Your logging system may be an agentic threat vector
And if you run Nutrient Document Engine, it ships with OpenTelemetry support out of the box.