Rendering huge PDFs without running out of memory on Android

Table of contents
- A single dense PDF page can need on the order of a gigabyte to parse — enough to get an app killed on a low-RAM phone.
- Android’s urgent
onTrimMemory(TRIM_MEMORY_RUNNING_CRITICAL)signal stopped being delivered in Android 14 and was deprecated in Android 15, so the SDK needed its own pressure signal. - The first fix was bounding the parsed-page cache by bytes — 10 percent of RAM, clamped to 256 MiB–1.5 GiB — with least-recently-used eviction.
- A memory monitor now tracks native heap, physical free memory, swap, and stuck trims separately. It trims caches at
Criticalpressure and aborts only atEmergency, when continuing would likely get the process killed. - In tests from 2.5 GB to 11 GB, only the 2.5 GB device needed abort-and-retry recovery; the larger devices stayed within budget and avoided crashes.
Rendering a PDF page means parsing its content, and a dense computer-aided design (CAD) drawing or high-resolution scan can need on the order of a gigabyte of working memory for a single page. On a 2.5 GB phone, that’s the difference between a rendered page and a process the operating system (OS) silently kills.
This is the story of the memory monitor we built for Nutrient Android SDK, and how it lets the renderer back off under memory pressure instead of crashing.
The Android signal that went away
The classic way an Android app learns that memory is tight is ComponentCallbacks2.onTrimMemory(opens in a new tab). The system calls it with a level, and the most urgent one — TRIM_MEMORY_RUNNING_CRITICAL — means the system will start killing background processes soon; free what you can. An SDK can hook it and drop whatever caches it’s holding.
Two things were wrong with relying on this, and the second one is fatal.
First, as of Android 14, the system stopped delivering the running-level trim callbacks, and in Android 15, they were formally deprecated; the guidance is to handle only TRIM_MEMORY_UI_HIDDEN and TRIM_MEMORY_BACKGROUND. The signal we depended on quietly went away.
Second — and this was true even before the deprecation — the callback fires too late and too bluntly to help with what actually uses the memory. For a viewer, that’s the page cache: The SDK keeps recently viewed pages parsed in memory so paging back and forth stays instant, and pressure almost always comes from one of two things — too many pages cached at once, or a single outsized page (a dense CAD drawing, a high-resolution scan) whose parsed form is enormous on its own. The lever that actually helps is shrinking that page cache and dropping the image cache (the full-page bitmap cache described below), not releasing whole documents. And nothing the callback did could reach a parse already in flight: By the time it fired, the gigabyte allocation was often already underway inside the native engine, holding a lock, with no check that would let it stop.
We needed something proactive that could see pressure coming and abort the specific work causing it, so we built it.
First, bound the cache by bytes
Before any of the pressure machinery, one thing had to change about the page cache itself: nothing bounded it by size. It was capped by page count, which says nothing about memory — a hundred cached text pages cost almost nothing, and a handful of dense CAD pages cost gigabytes. That was the direct cause of a customer crash we spent a long time chasing: On a 7.2 GB device, the retained page cache grew to roughly 3 GB with no limit that could see it, and the OS killed the app.
So each document provider now gets a page-cache budget measured in bytes — 10 percent of device RAM, clamped to between 256 MiB and 1.5 GiB — enforced continuously rather than at pressure time. When a newly parsed page pushes the cache past the budget, Core evicts least-recently-used pages, protecting the one currently being rendered. Eviction is cheap and non-destructive: Full-page bitmaps are also persisted to an on-disk cache, so an evicted page is re-served from disk rather than reparsed.
That budget is what keeps steady-state memory flat, and it changes what the rest of this post is for. The polled monitor below isn’t a cache-sizing mechanism — the budget already does that job continuously. It’s a response to abnormal pressure: the spike a single outsized page creates while it parses, which no cache budget can prevent because the memory is in flight and not yet in any cache.
A memory monitor that watches the heap
MemoryNotificationHandler polls native heap allocation on a background coroutine — every 500 ms while memory is calm, tightening to every 100 ms the moment pressure shows:
// 500 ms while idle; 100 ms once the pressure level is elevated (≠ OFF).val nativeHeapBytes = Debug.getNativeHeapAllocatedSize()It reads the device’s total RAM once to scale its thresholds to the hardware. Then, each poll reads two runtime pressure signals: ActivityManager.MemoryInfo (free system memory and the OS low-memory flag) and /proc/meminfo (the kernel’s SwapFree/SwapTotal). Swap turns out to matter as much as free RAM — more on that below. One honest caveat we document in the code: getNativeHeapAllocatedSize under-reports the real footprint — it misses large mmap’d and allocator regions — so the true memory use is higher than the number we poll. We tune the thresholds with that in mind.
Instead of reacting after the OS notices, we watch the heap climb in real time and act while there’s still headroom to act in. The cadence is adaptive for a reason we learned the hard way: A single heavy page can spike the native heap by more than 2 GB between consecutive polls — fast enough that the first elevated reading can already land past the point of no return, so the instant any pressure shows, we poll five times as often, cutting that worst-case detection gap to a fifth, and drop back to the cheaper rate once the heap settles — the extra reads happen only during an active episode. But polling is still fundamentally reactive, and that limitation drives the free-memory escalations below.
Four levels, four responses
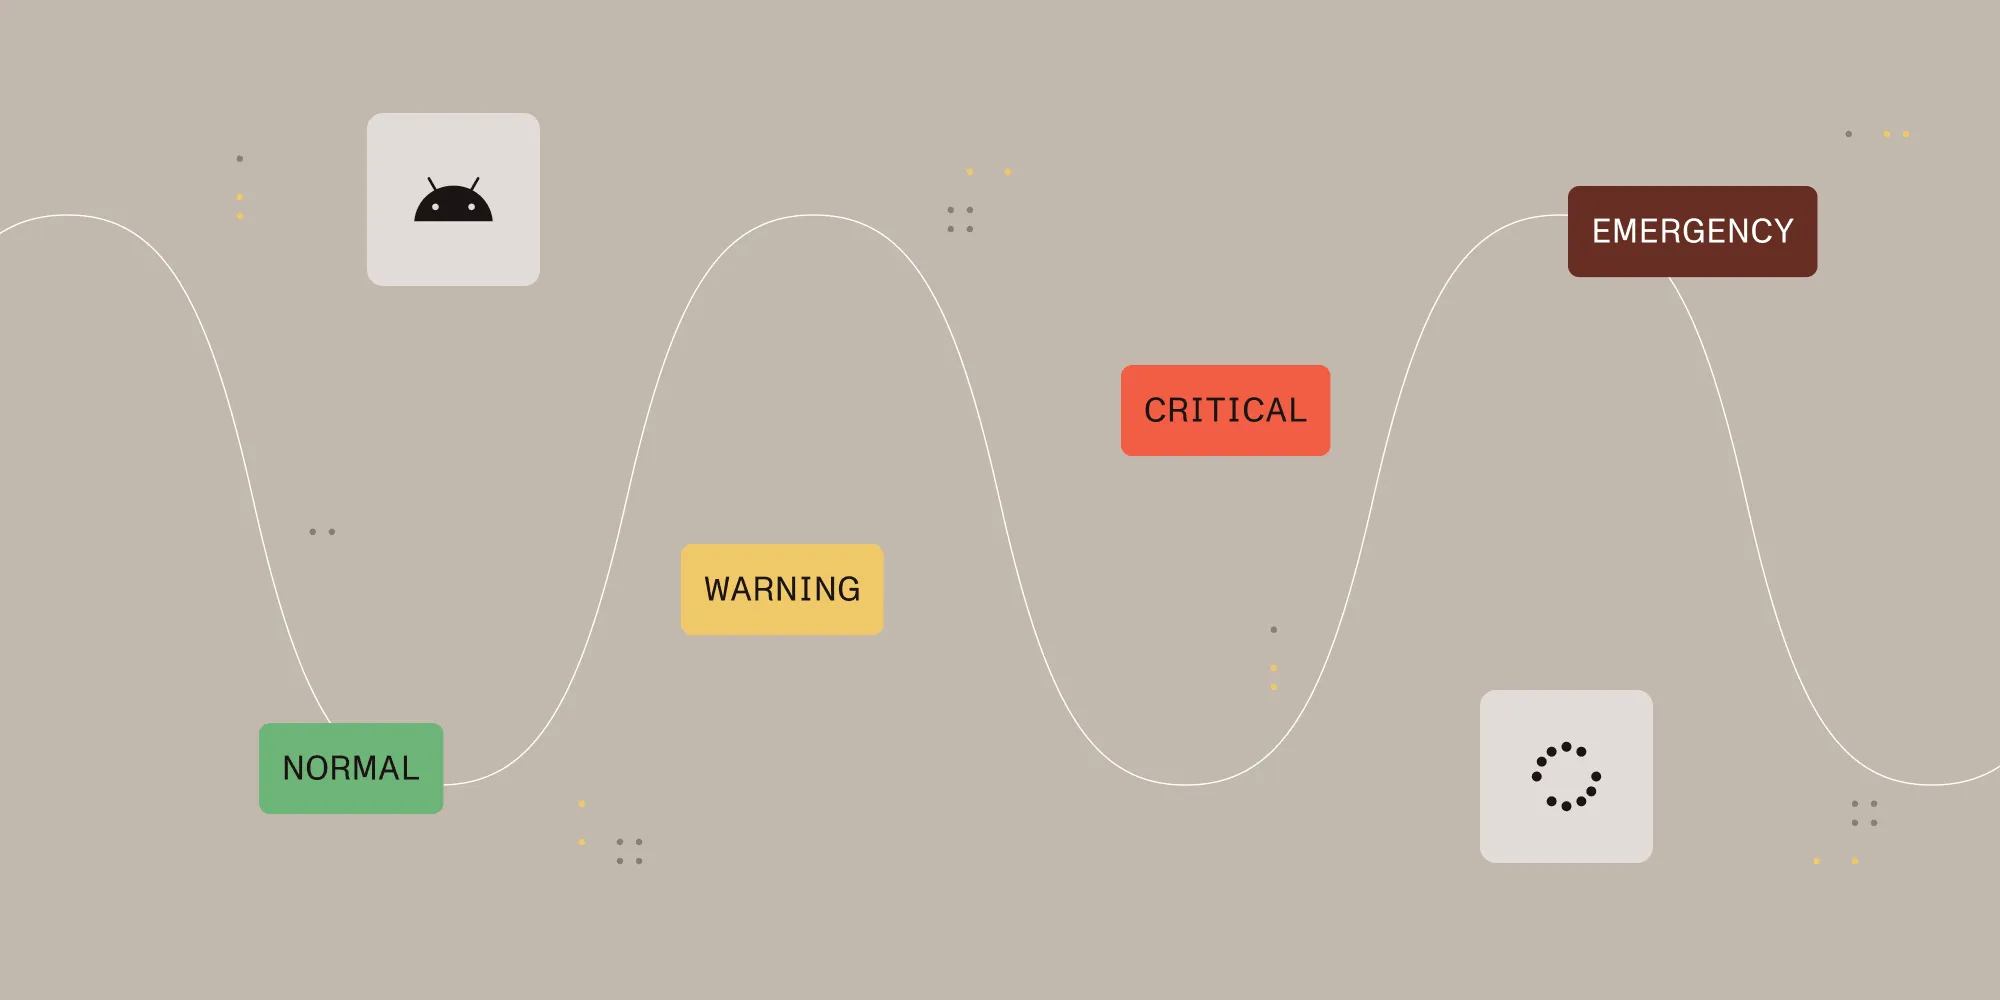
Each poll classifies the heap into one of four levels. The thresholds are proportional with a cap: On a large-RAM device, they pin to an absolute ceiling; on a low-RAM device, they scale to a fraction of total RAM, so a 2.5 GB phone reacts much earlier in absolute terms than an 8 GB one.
| Level | Fires around | What happens |
|---|---|---|
Normal | Below all thresholds | Nothing — render freely. |
Warning | 50 percent of RAM, or 3 GB | Core drops cheap caches. In-flight work continues. |
Critical | 70 percent of RAM, or 4 GB | Core trims the page cache and the platform clears its page caches. A render in flight is not aborted. |
Emergency | 90 percent of RAM, or 5.5 GB | Sheds roughly half the full-page bitmap cache. Then aborts the in-flight page parse and fails the page. |
Because the tiers are proportional-with-cap, here’s where they actually land across device classes — the native-heap tiers, plus the two free-memory floors the later sections describe (the physical-availMem floor and the flat swap-exhaustion floor):
| Device RAM | Warning heap | Critical heap | Emergency heap | availMem floor | swap floor |
|---|---|---|---|---|---|
| 2 GB | 1,024 MB | 1,434 MB | 1,843 MB | 164 MB | 100 MB |
| 4 GB | 2,048 MB | 2,867 MB | 3,686 MB | 328 MB | 100 MB |
| 6 GB | 3,072 MB | 4,000 MB | 5,500 MB | 492 MB | 100 MB |
| 8 GB | 3,072 MB | 4,000 MB | 5,500 MB | 655 MB | 100 MB |
| 12 GB | 3,072 MB | 4,000 MB | 5,500 MB | 768 MB | 100 MB |
Each tier stops scaling once the device is big enough to reach its absolute cap — Warning at 6 GB of RAM, Critical at about 5.7 GB, Emergency at about 6.1 GB — so every roomy device shares the same three ceilings and only smaller devices act proportionally lower. The physical-availMem floor (min(768 MB, 8 percent of RAM)) is deliberately conservative — low free memory only triggers a trim, never an abort on its own.
The split between Critical and Emergency is the part that keeps heavy pages renderable. A single large page can trip Critical on its own; aborting there would create a loop where the page retries, recreates the same pressure, and aborts again, so Critical trims caches and lets the parse continue. Emergency means the process is near the edge, so it first sheds cheap full-page bitmap cache and then aborts the in-flight parse if needed.
That edge is closer than device RAM suggests. We found that Android kills an app at roughly 6 GB of process memory, regardless of how much RAM the phone has. That’s why the Emergency tier caps at 5.5 GB rather than scaling indefinitely; on a 16 GB phone, a 90 percent threshold would be a line the OS never lets us reach.
(On iOS, the OS hands us a single critical-memory signal, so the two levels collapse into one. Android, where we infer pressure from a polled heap number, needs the finer split.)
Condensed, a real episode from a 2.5 GB device reads like this — the whole thing, escalation to recovery, takes about a second:
13:06:01 Nutri.MemTrace: poll — heap 1189MB, avail 282MB, level OFF, lowMemory=false, MemAvailable=100MB, SwapFree=856/1858MB13:06:02 Nutri.MemTrace: poll — heap 1219MB, avail 306MB, level OFF, lowMemory=false, MemAvailable=157MB, SwapFree=800/1858MB13:06:02 Nutri.MemTrace: pressure level OFF → EMERGENCY (OS low memory) — heap 1437MB, available 158MB / total 2478MB, lowMemory=true (thresholds warn/crit/emerg 1239/1734/2230MB, availFloor 198MB, swapFloor 100MB)13:06:03 MemoryHandling: Stop parsing: page used memory: 340 MiB, total physical memory: 2478 MiB, current total memory usage: 895 MiB, context: [pageIndex=29]13:06:03 Nutri.MemTrace: pressure level EMERGENCY → OFF — heap 561MB, available 644MB / total 2478MB, lowMemory=false13:06:03 Nutri.MemTrace: Memory pressure cleared — re-arming pages backed off during the episode.13:06:03 DocumentProvider: CRITICAL memory: page cache 0MiB, physical 2478MiB. Reducing page cache to 1.13:06:03 LowMemoryService: Disabling image cache for the next 300000 milliseconds.Note what the heap numbers say about why this escalated. At 1,437 MB, the heap is in the Warning band and nowhere near its own 2,230 MB Emergency tier — the level jumped straight to Emergency because availMem had fallen to 158 MB and the OS set lowMemory — a signal severe enough on its own to force Emergency regardless of which heap tier the poll landed in (more on why in the next section). Page 29’s parse is aborted, and one poll later, the heap is at 561 MB with 644 MB free again.
When the heap number lies
The pressure logic was shaped by crashes that each exposed a blind spot in the previous signal. No single number was reliable enough on its own:
| Signal | What it catches | Where it lies | Response |
|---|---|---|---|
| Native heap | Our process growing toward its per-app ceiling | Under-reports mmap’d and allocator regions, and misses pressure caused by the rest of the system | Drive the Warning/Critical/Emergency tiers |
lowMemory | The OS warning that the low-memory killer is close | Can flip too late, or not at all, on devices whose allocator fails first | Force Emergency when our heap is already past Warning |
Physical availMem | Actual free physical headroom | Can look low on swap-backed devices that are still healthy | Drop to Critical and trim, but don’t abort by itself |
SwapFree | Whether zram/swap has any elastic buffer left | Free swap can still be hot, thrashed memory rather than usable headroom | Force Emergency only when swap is nearly dry and availMem is also low |
Stuck Critical | A trim that can’t reclaim memory, often because the parse still holds the render lock | Only means “our parse is the hog” if the heap tier reached Critical | Promote to Emergency after about a second |
The main trap was swap. Our first instinct was to treat total headroom as availMem + SwapFree, but a 7 GB device with 8 GB of zram proved that wrong: The process was killed at a 5 GB native heap while 5.4 GB of swap still showed free. The kernel log showed why: thrashing, 302 percent. The parse was touching hot pages faster than the kernel could keep them resident, so “free” swap wasn’t usable headroom.
So the monitor keeps physical memory and swap separate. Low availMem trims only. Swap exhaustion escalates only when physical memory is also low. And a Critical heap state that doesn’t clear after trimming becomes the proxy for thrashing: If memory doesn’t come down, the trim isn’t reclaiming anything, so we promote to Emergency and abort the parse that’s holding the working set.
That gives us a ladder instead of a single trigger. Low physical memory trims. The OS lowMemory flag, exhausted swap plus low physical memory, a stuck heap-tier Critical, or the heap crossing its own Emergency tier aborts. The abort matters because it releases the PDFium mutex the parsed-page-cache trim needs — PDFium is the native rendering engine doing the actual parsing, and it holds a lock on the page while it works. Without that release, the trim can queue behind the very parse consuming memory.
Into the parse
Trimming caches is the easy half. The hard half is reaching into a running native parse and stopping it. Core does this with a stopper object that a parse polls as it works.
When a render starts, it registers a stopper that says only an emergency concerns me:
MemoryHandling::OOMBehaviorConfiguration oomConfig;// This is the visible page the user is waiting on. Abort it only at `Emergency` (the// process is about to be OS-killed) — not at `Critical`, which merely trims caches.oomConfig.requiredNotificationLevel = MemoryNotificationLevel::Emergency;
auto stopper = MemoryHandling::registerParseContentCall(/* page, context, */ oomConfig);
CancellableDocumentGuard parseGuard([taskProgress, stopper]() -> bool {    return taskProgress->isTaskCancelled() || stopper->NeedToPauseNow();});
rawPage->ParseContent(&parseGuard);
if (parseGuard.NeedToPauseNow()) {    rawPage->PSPDF_resetParseContent(); // drop the partially-built objects.    m_status = stopper->NeedToPauseNow() ? Status::FailedOom : Status::Cancelled;    return m_status;}
When the monitor fires a notification, the handler doesn’t do any heavy work on the spot — it just flags every live stopper with the level it saw. The parse loop checks that flag between operations, locklessly, and decides whether to stop:
// Act only when the received notification is at least as severe as the level this parse// requires. A render parse requires `Emergency`, so a `Critical` notification — which// trims caches elsewhere — does not abort it; only `Emergency` does.if (memoryNotificationSeverity(*received) < memoryNotificationSeverity(requiredLevel)) { logger.d("Level too low ({}, required {}), not stopping.", *received, requiredLevel); return false;}An aborted parse surfaces to the platform as the FAILEDOOM status (distinct from a normal CANCELLED), which the Android side turns into a typed OomRenderFailedException so callers know to back off rather than immediately retry the exact work that was just aborted.
Deciding a page is too big to render
The monitor handles pressure that builds up over time. But some pages are doomed from the start — big enough that trying to parse them would blow the budget no matter what else is happening. Core catches those with three independent gates, checked between parsed objects:
- Compressed content size. Before committing to a parse, compare the page’s compressed content streams against a
maxContentSizeceiling. If the compressed content already exceeds it, the decompressed working set has no chance of fitting — fail early, before allocating anything. - Available-memory headroom. Even with no OS pressure signal, a process can hit its own per-process allocation limit, at which point the next allocation inside the engine would abort the process outright, so we stop if available memory drops below a floor (256 MB by default) and return a clean out-of-memory (OOM) result instead of letting that fatal allocation happen.
- Notification severity and page-size ratio. Once a notification arrives, only stop if it’s severe enough and the page is actually large relative to total memory — so a small page isn’t sacrificed for pressure that something else caused.
Together these turn “the app crashed” into “this one page reports that it’s too large to render,” which the UI can show as a placeholder while everything else keeps working.
Backing off, then recovering
A failed render isn’t the end of the story — the goal is to recover automatically once memory frees up. When a render is aborted under pressure, the page enters a RENDER_FAILED backoff state rather than retrying immediately. When the monitor later sees pressure clear, it bumps a recovery signal that rearms backed-off pages for one more attempt.
There’s a trap here we had to design around: a page whose own render is the source of the pressure. It aborts, pressure clears, it rearms, and then it recreates the same pressure. To avoid that livelock, each page gets only two OOM aborts. After that, it lands in a terminal RENDER_FAILED_PERSISTENT state that the automatic rearm ignores and the UI shows as a “not enough memory” placeholder. If the page is the one the user is viewing, we also send one host advisory so the integrating app can react.
There’s a mirror-image trap on the other side: pressure that never clears. The rearm above waits for the monitor to see memory recover — but on a device whose working set structurally sits above the Warning line, that recovery poll can simply never come, and a page aborted once would wait for a green light that never arrives, so a second bound covers it: Once the episode has spent enough polls at Emergency without ever recovering (counted across the whole episode, so an oscillating Warning ⇄ Emergency squeeze still trips it), the monitor concludes recovery isn’t coming on its own and forces the rearm anyway. The page retries, refails, spends its abort budget, and lands on the same terminal placeholder — degrading to “this page is too big for this device right now” instead of hanging on a blank forever.
One last piece lives in the UI, and it’s what lets the aggressive escalation above stay invisible. A transient Emergency abort that rearms a poll cycle later is work the user should never see — the page wasn’t really lost — but naively, the RENDER_FAILED state would flash the alarming “not enough memory” placeholder for a split second before the retry replaced it, so the placeholder is debounced: A RENDER_FAILED page waits about a second before showing anything, and if it rearms inside that window, the user sees only the brief loading state, but never the error. A RENDER_FAILED_PERSISTENT page — one that has spent its retries and won’t recover — skips the debounce and shows the placeholder immediately, because there’s nothing left to wait for. This is the safety net that makes escalating on the first lowMemory poll safe: Even if we occasionally abort a render that would have finished, the abort-then-recover cycle never surfaces as a visible glitch.
The whole pipeline, then, is a graceful-degradation ladder: Detect pressure by polling, trim caches, abort the in-flight parse only at the true edge, back off the failed page, and rearm it when memory recovers — with a bounded number of retries and a single escalation when recovery genuinely can’t happen. Every level transition logs at INFO to one tag, Nutri.MemTrace — at INFO, deliberately, so a whole pressure episode is legible in a release build with the heap, the system available and total memory, the OS lowMemory flag, and the active thresholds all on the line that records the change. One filter reads the episode end to end:
adb logcat -s Nutri.MemTrace MemoryHandlingDoes it hold up? Real numbers from 2.5 GB to 11 GB
The point of all this is a phone that doesn’t crash. To check, we opened the same 216-page CAD work package — a 184 MB file whose opening sheets are dense enough to spike the heap by a gigabyte apiece — on four devices spanning the range: a 2.5 GB emulator, a 4 GB emulator, a Galaxy Tab S9 (7 GB with 8 GB of zram), and a Galaxy Z Flip 7 (11 GB with 12 GB of zram). Same scenario each time: page through the heavy pages at roughly one per second, from a cold cache, in a release build, with the memory trace sampling heap, available memory and swap on every poll — 500 ms at rest, 100 ms once pressure shows.
In each chart, the native heap is blue, physical availMem is aqua, and SwapFree is violet — the three are plotted separately, never summed. The shaded bands are the Warning/Critical/Emergency heap thresholds, in the same colors the diagram at the top of this post uses. The physical-availMem floor and the 100 MB swap-exhaustion floor are dashed reference lines in their series’ color, and a vertical mark shows a poll where an in-flight parse was aborted. One thing to read carefully: low physical availMem isn’t an abort. It only makes the SDK trim caches more aggressively (it drops to Critical) while the render keeps going. An abort comes from one of the harder signals instead: the OS lowMemory flag, swap running dry while physical memory is low, a heap-tier Critical that stays stuck (the thrash proxy), or the heap crossing its own Emergency tier.
Each chart is a 40-second window from a two-to-four-minute run, centered on the busiest stretch.
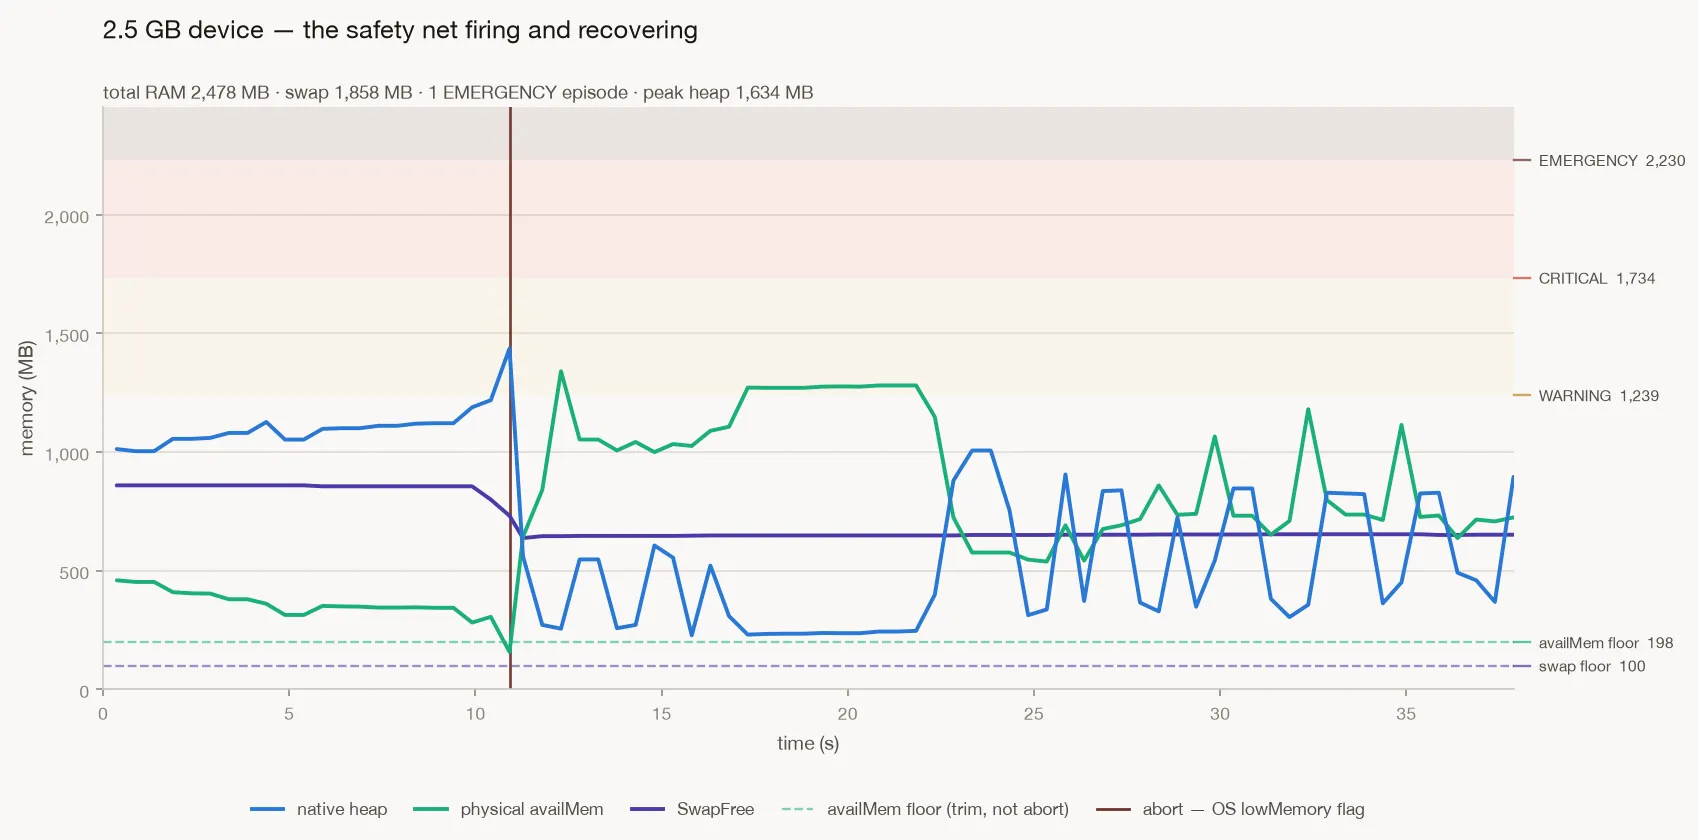
2.5 GB — This is the safety net doing its job. The heap climbs to 1,437 MB while availMem drains to 158 MB, through its 198 MB floor. The OS lowMemory flag flips, the in-flight parse is aborted, and within a second, the heap is back at 561 MB and availMem at 644 MB. The full run had three such episodes and four aborted parses, with zero crashes — on the class of device that used to die outright. Note where the abort came from: The heap peaked at 1,634 MB against its own 2,230 MB Emergency line, so the heap tier would have caught none of it.
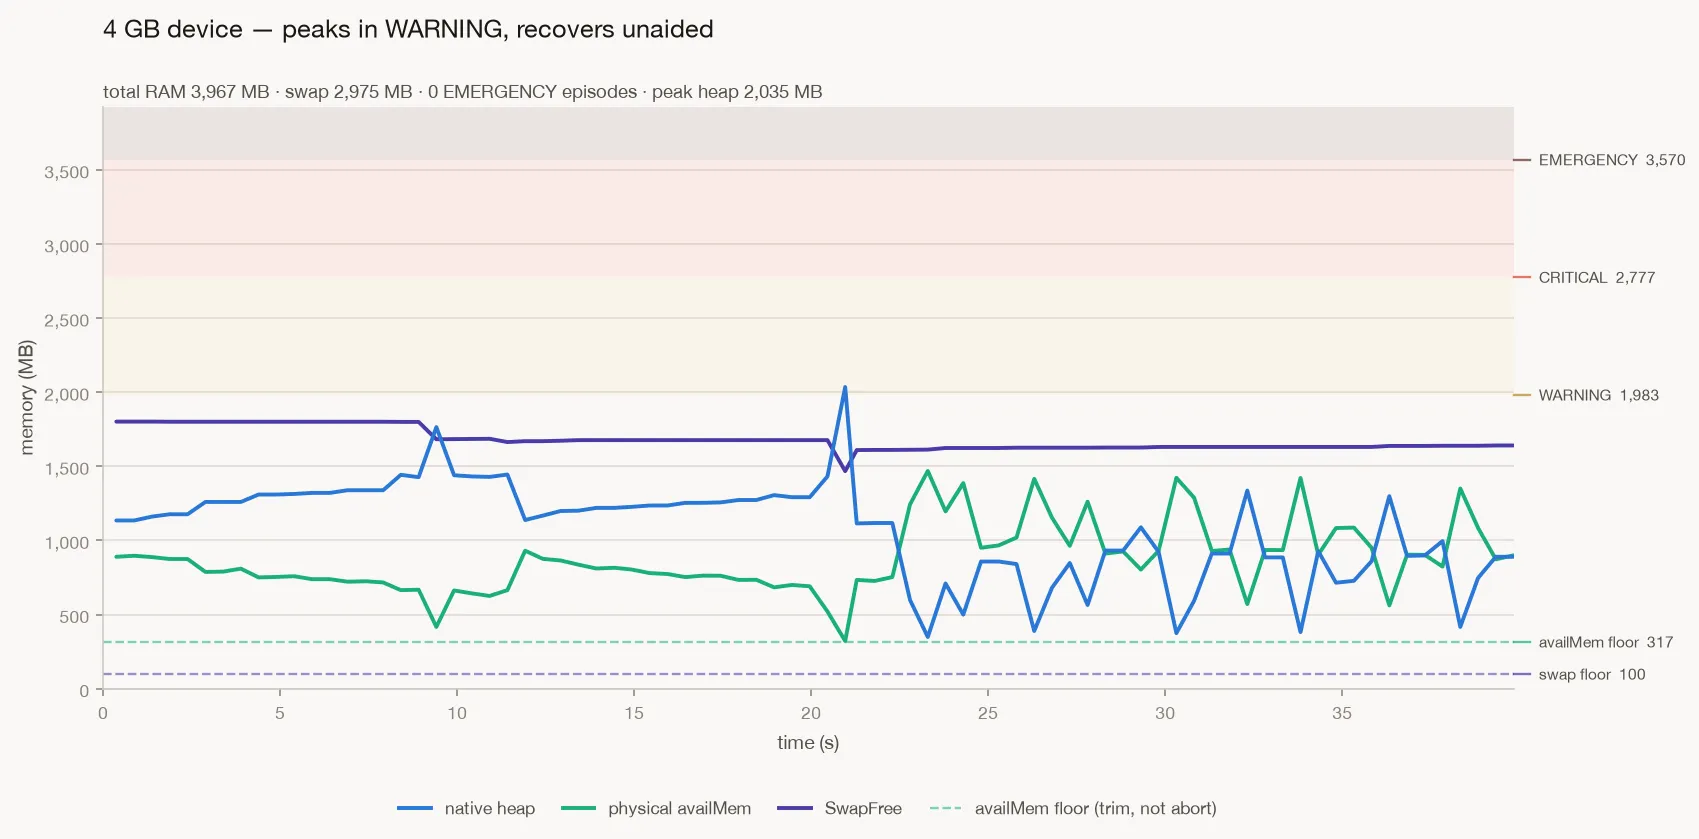
4 GB — This is pressure without escalation. The heap peaks at 2,035 MB, just into the Warning band, and availMem bottoms at 288 MB. Core drops its cheap caches and the run continues; nothing is aborted, and the user sees nothing at all. This is the intended common case: The lightest tier of the response is enough.
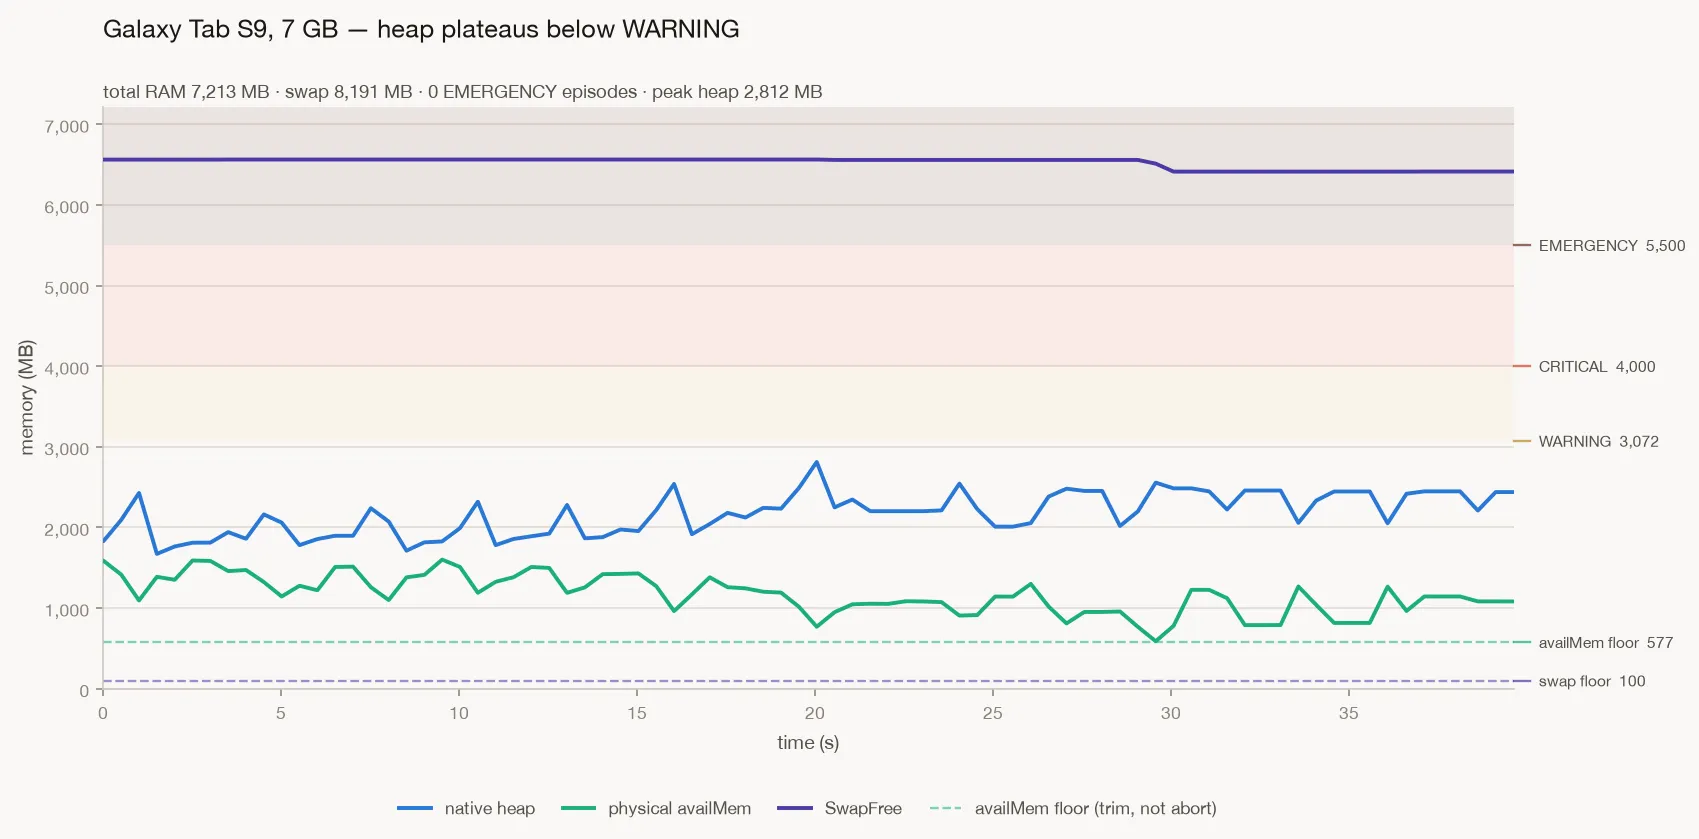
Galaxy Tab S9, 7 GB with 8 GB of zram — This is the device that used to thrash. The heap plateaus at 2,812 MB and simply stays there, never reaching the 3,072 MB Warning line, while availMem holds at 589 MB and swap barely moves. The plateau is the page-cache byte budget holding: 721 MB on this device, enforced continuously. This is the same hardware profile as the thrash crash described earlier, and on the shipped build, the condition no longer arises.
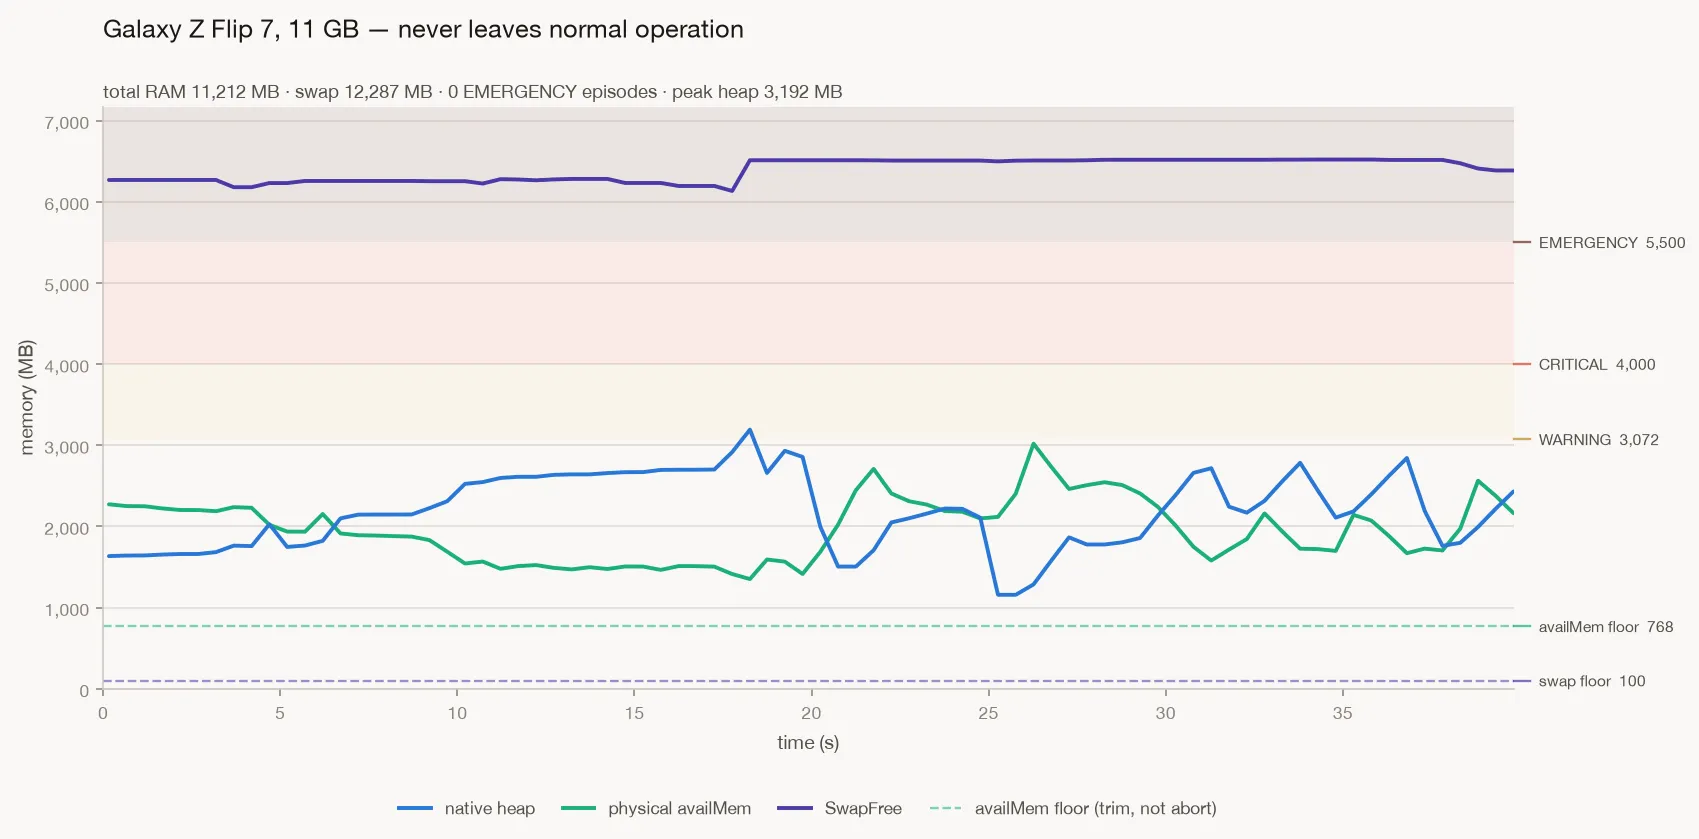
Galaxy Z Flip 7, 11 GB with 12 GB of zram — This is for scale. Every threshold sits far above the data: The heap tops out at 3,192 MB against a 5,500 MB Emergency line, availMem never drops below 1,351 MB against a 768 MB floor, and SwapFree is a flat 6.4 GB. On a device this roomy, the memory system is inert, which is exactly what it should be.
| Metric | 2.5 GB emulator | 4 GB emulator | Galaxy Tab S9 | Galaxy Z Flip 7 |
|---|---|---|---|---|
| Total RAM | 2,478 MB | 3,967 MB | 7,213 MB | 11,212 MB |
| Swap (zram) total | 1,858 MB | 2,975 MB | 8,191 MB | 12,287 MB |
Thresholds warn/crit/emerg | 1,239/1,734/2,230 MB | 1,983/2,777/3,570 MB | 3,072/4,000/5,500 MB | 3,072/4,000/5,500 MB |
availMem floor/swap floor | 198 / 100 MB | 317 / 100 MB | 577 / 100 MB | 768 / 100 MB |
| Page cache byte budget | 256 MiB | 396 MiB | 721 MiB | 1,121 MiB |
Peak heap vs. Emergency threshold | 1,634 / 2,230 MB | 2,035 / 3,570 MB | 2,812 / 5,500 MB | 3,192 / 5,500 MB |
Min availMem vs. its floor | 154 / 198 MB | 288 / 317 MB | 589 / 577 MB | 1,351 / 768 MB |
Min SwapFree | 467 MB | 1,468 MB | 6,413 MB | 6,133 MB |
| Highest level reached | Emergency | Warning | Normal | Warning |
Emergency episodes/aborts | 3 / 4 | 0 / 0 | 0 / 0 | 0 / 0 |
| Crashes | 0 | 0 | 0 | 0 |
Read down the table and the shape is the point: The response scales with actual risk, and on most devices, it never has to act at all. Only the 2.5 GB device went under its availMem floor and needed aborts. Every other device stayed at least 1.5 GB clear of its Emergency heap line, with physical free memory above its floor.
Most of that stability comes from the parsed-page cache budget. On the Tab S9, for example, the heap climbs to 2,812 MB and then flattens because the cache stops growing. The pressure monitor is the backstop behind that budget — and a backstop doing nothing on three devices out of four is the system working.
Where it does fire, it preserves the document. On the 2.5 GB device, each abort dropped the biggest live allocation, released the render lock so trimming could reclaim memory, and let the page rerender after pressure cleared. The user sees a brief loading state at worst, not a missing page.
One caveat: These are runs, not permanent device properties. The same 4 GB emulator can escalate if its free-memory baseline starts lower. What generalizes is the ordering — smaller devices escalate sooner and further — not the exact count.
Takeaways
The platform signal we’d depended on for years went away, and replacing it forced a better design: watch several imperfect signals, decide which one wins, and respond before the OS kills the process. The most important lesson was that no single number is enough. Heap, lowMemory, physical free memory, swap, and stuck trims each catch a different failure mode.
The other reusable idea is separating trim the caches from abort the work. A single low-memory Boolean would either abort too eagerly, making heavy pages impossible to render, or too late, letting the app die. With separate Critical and Emergency levels, the SDK can give a large page room to finish, stop it only at the true edge, and recover without losing the document.
These memory-handling improvements are available in Nutrient Android SDK 11.6. See the Android 11.6 release notes for the full details.