Adding a KPI’s widget
This guide explains how to add and configure a KPI’s widget on a dashboard in Workflow Automation.
Adding the KPI’s widget to an admin dashboard provides you with real-time visibility into key performance indicators (KPIs) for processes. This widget displays summarized KPI data, such as average time spans between start and end tasks, enabling you to assess process efficiency and identify areas needing attention. The dashboard view uses color-coded indicators (green, yellow, red) to show whether performance is meeting targets, approaching thresholds, or exceeding limits. Additionally, you can drill down to see which requests are included in the KPI, view detailed timing, and — if enabled — adjust the time span for analysis. This centralized, visual access to process metrics supports data-driven decision-making and continuous process improvement.
Adding a KPI’s widget
To add a KPI’s widget, follow the steps below:
- Go to the Dashboards layout page for a dashboard.
- Click Add Widget in the upper-right corner of the page.
- On the pop-up that appears, select KPI’s and click Add Widget to proceed. Click Cancel to terminate the operation.
Newly added widgets appear at the bottom of the dashboard. Scroll down to find, move, or edit them.
Adding KPIs to the widget
To add a KPI:
- Click the Add KPI option in the widget.
- You can view a list of available KPIs. For each KPI, you can view the following details:
- Name
- Type (gauge, barChart)
- Process for which KPI is created
- On the pop-up that appears, select
 a KPI that you want to add from the list. You can select more than one KPI.
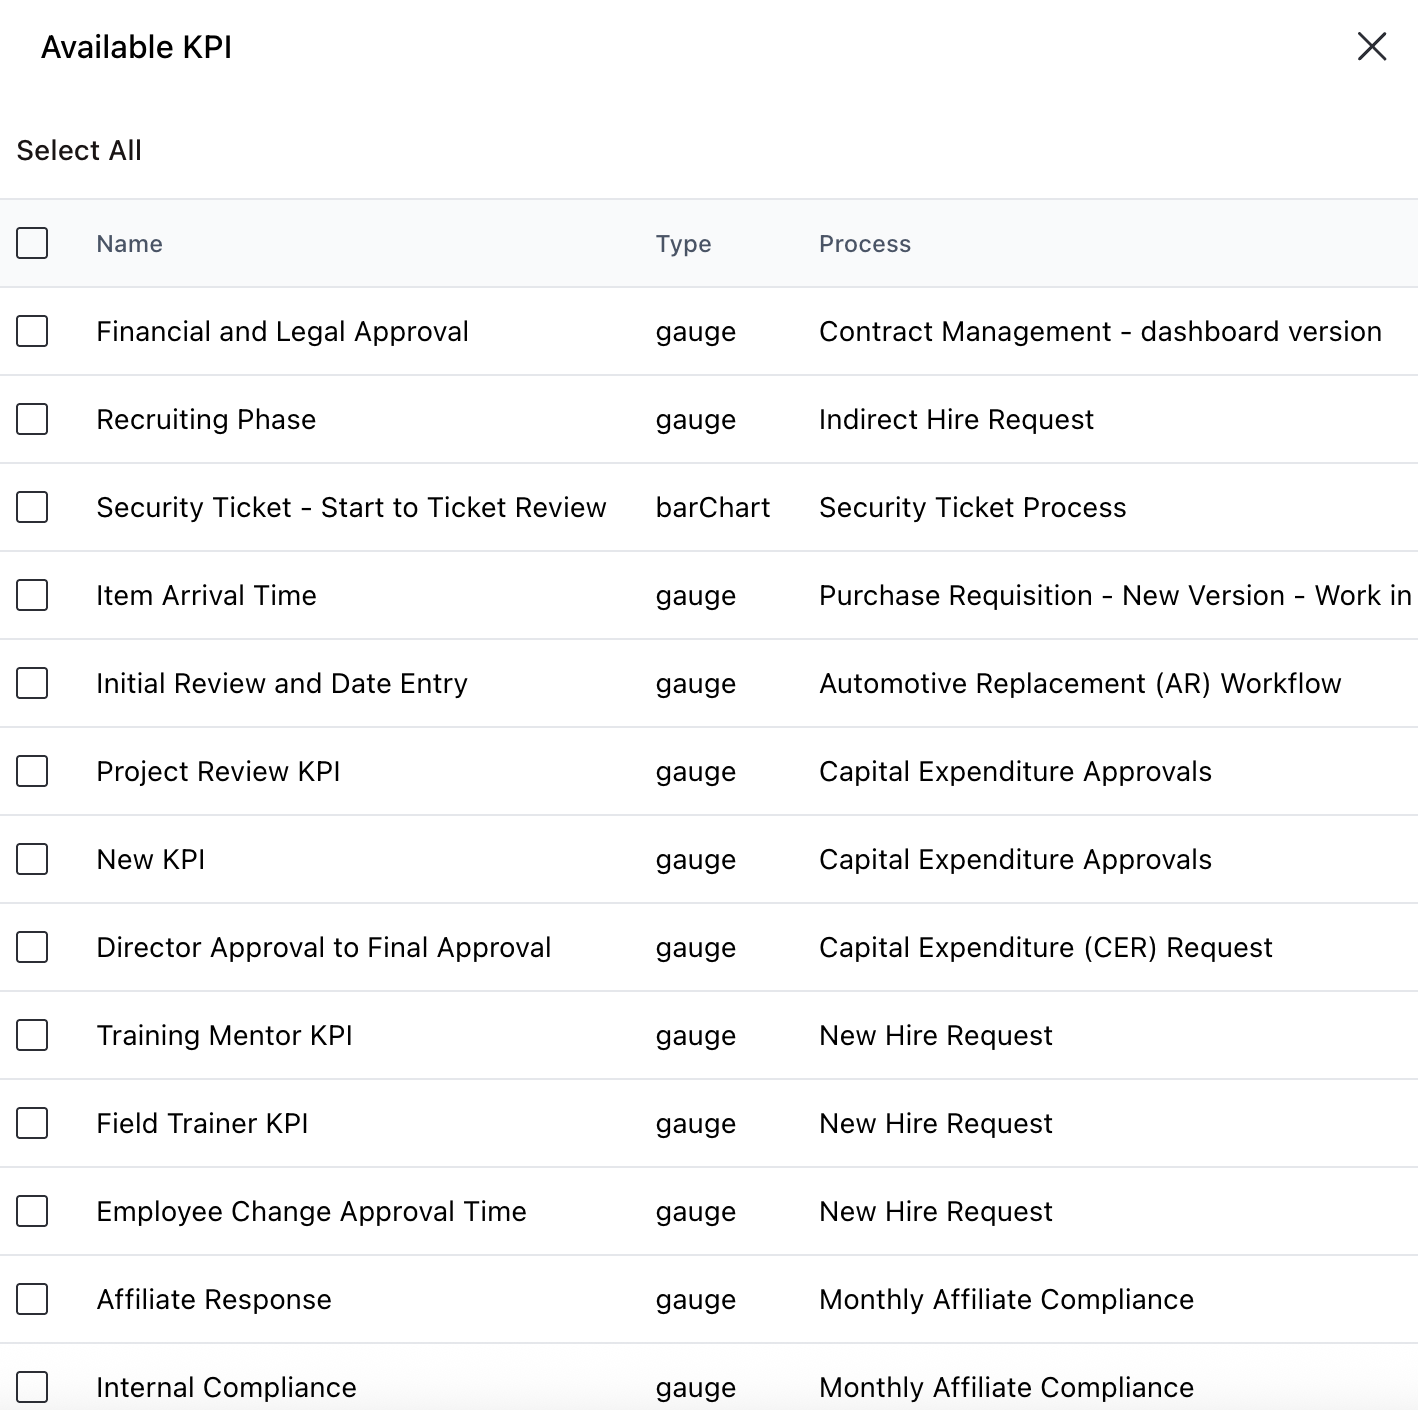
- Click Add Selected KPIs at the bottom of the list to proceed.
KPI actions
Click the three dots ![]() icon in the upper-right corner (visible inside the KPI area) to perform the following actions:
icon in the upper-right corner (visible inside the KPI area) to perform the following actions:
KPI Settings — Select this option to configure display settings for the KPI, including:
- Labels — Show Labels (displays the numerical range labels on the KPI), Show only min/max (displays only the minimum and maximum values of the KPI’s range).
- Key — Show Key (displays a legend explaining what each color segment on the KPI represent); has two display options — Horizontal or Vertical.
- Styling — Traffic (uses a color scheme associated with performance indicators), Monochromatic (applies shades of a single color), or Complementary (uses colors that contrast to create visual distinction).
Click Apply in the lower-right corner to save changes or Close to exit the pop-up.
View Requests — Select this option to view a list of all the requests that are included in the KPI’s time span. These requests are directly related to the process for which the KPI is created — they represent individual instances of that process where the KPI measurement (such as time between two tasks) is being tracked. For each request in the list, you can view instance ID, time elapsed (in minutes), and completed. Click the Close
 icon in the upper-right corner to exit the pop-up.
Remove KPI — Select this option to remove the KPI from the widget.
Additionally, depending on the configuration of KPI definition, you can also Set Date Range — Select this option to configure the start and end date for which the KPI data should be calculated and displayed. Click Confirm in the lower-right corner to save the configuration or Close to exit the pop-up.
Changing the added KPI in the widget
To change the added KPI in the widget and replace it with a different one:
- Click the three dots
 icon in the upper-right corner of the widget.
 - Select the Remove KPI option from the dropdown.
- Click the Add KPI option in the widget.
- On the pop-up that appears, select a KPI that you want to add from the list. You can select more than one KPI.
- Click Add Selected KPIs at the bottom of the list to proceed.
Changing the widget layout
You can resize and reposition the KPI’s widget for improved readability and layout fit by dragging and dropping it for better usability.
Editing widget settings
To edit widget settings:
- Click the three dots icon in the upper-right corner of the widget and select the Edit widget option from the dropdown.
- On the pop-up that appears, you can edit the following settings:
- Widget name — Modify the label that appears on the widget header.
- Link/unlink widget content and settings
- Linking keeps the widget content and configurations consistent across all screen sizes.
- Unlinking enables you to customize the widget layout or content independently for each screen size — useful for optimizing display for mobile vs. desktop.
- Relinking restores shared behavior, overriding any screen-specific edits made while unlinked.
- Add/delete widget on a screen
- Click the Add
 icon to include the widget on additional screen sizes.
 - Click the Delete
 icon to remove the widget from a particular screen size without affecting its presence on others.
- Click the Add
Deleting the widget
To delete the widget:
- Click the three dots icon in the upper-right corner of the widget.
- Select the Delete widget option from the dropdown.
Saving changes
Once you finish customizing the widget:
- Click Save dashboard in the upper-right corner to apply the changes.
- Click Discard to cancel any unsaved edits.
Next steps
Refer to the guides below to learn about the following widgets and their configuration: