Customize dashboards for improved user experience
Modern dashboard
Overview
Use modern dashboards in Workflow Automation to configure tailored user interface screens for different roles or teams. Modern dashboards support widget-based layouts across multiple devices and provide a more flexible, responsive design compared to legacy dashboards. Hidden helper iframes remain idle until they’re opened or routed, helping dashboards and widget flows stay responsive.
Watch the enhancements in under 5 minutes
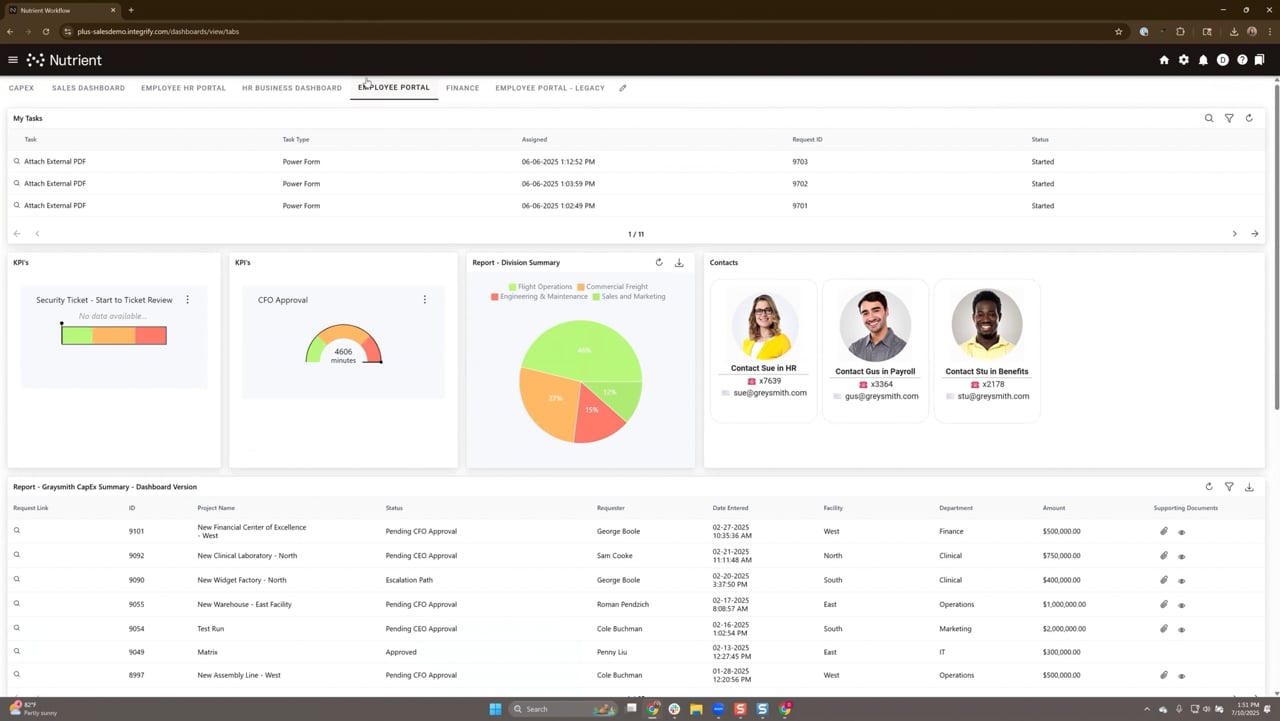
What you can do with dashboards
- Assign dashboards to individual users or user groups.
- Include widgets for forms, reports, charts, and other key components.
- Control access and visibility based on user roles and permissions.
What’s new in modern dashboards
Modern dashboards introduce several improvements over legacy dashboards, with a focus on layout control, widget behavior, and editing experience.
Enhanced interface
- Updated design with improved fonts, spacing, and mouseover interactions.
- Clean, responsive layout across four screen sizes: Desktop XL, Desktop, Tablet, and Mobile.
Improved widget editing
- Resize and reposition widgets independently at each screen size without resizing your browser.
- View which screen size each widget is placed on and manage its state (add, remove, or disconnect).
- Adjust layout without affecting the widget’s behavior or visibility on other screen sizes.
Data linking and unlinking
- Link widgets across screen sizes to maintain shared data while customizing visual elements (for example, buttons, text, color).
- Unlink widgets to make layout-specific adjustments without affecting others.
- Relink widgets to restore shared behavior and override previous changes.
Granular sizing and layout control
- Modify widget dimensions with greater precision compared to legacy dashboards.
- Dynamically adjust widget row counts based on height in certain widgets — Reports, My Tasks, My Requests, Manage Requests, and Monitor Requests.
- Toggle between dynamic or fixed row heights for task widgets — My Tasks, My Requests, Manage Requests, and Monitor Requests.
HTML, KPI, and Today’s Message widgets do not support row adjustments.
Improved edit mode
- Click report titles from the Dashboard layout page to open linked reports directly (based on user permissions).
- Streamline updates and navigation during dashboard configuration.
- Keep widget configuration modals aligned with the current scroll position so dialogs remain visible while editing dashboards.
- Maintain legacy KPI functionality without changes.
Example use cases
- Finance users — Display capital expenditure requests, vendor invoice approvals, and summary reports.
- Operations teams — Monitor open tasks and approval KPIs using dynamic widgets.
- Executives — Show high-level charts and division summaries in a read-only layout.
Guides
- Dashboard interface
- Roles and permissions
- Creating dashboards
- Dashboard layout
- HTML Panel widget
- Report widget
- My Tasks widget
- My Requests widget
- Monitor Requests widget
- Manage Requests widget
- KPI widget
- Today’s Messages widget