Nutrient Workflow Automation reporting provides detailed and summarized access to request data within a given process. You can display that data as a standalone report for individual users, or the system administrator can present it to users on the dashboard.
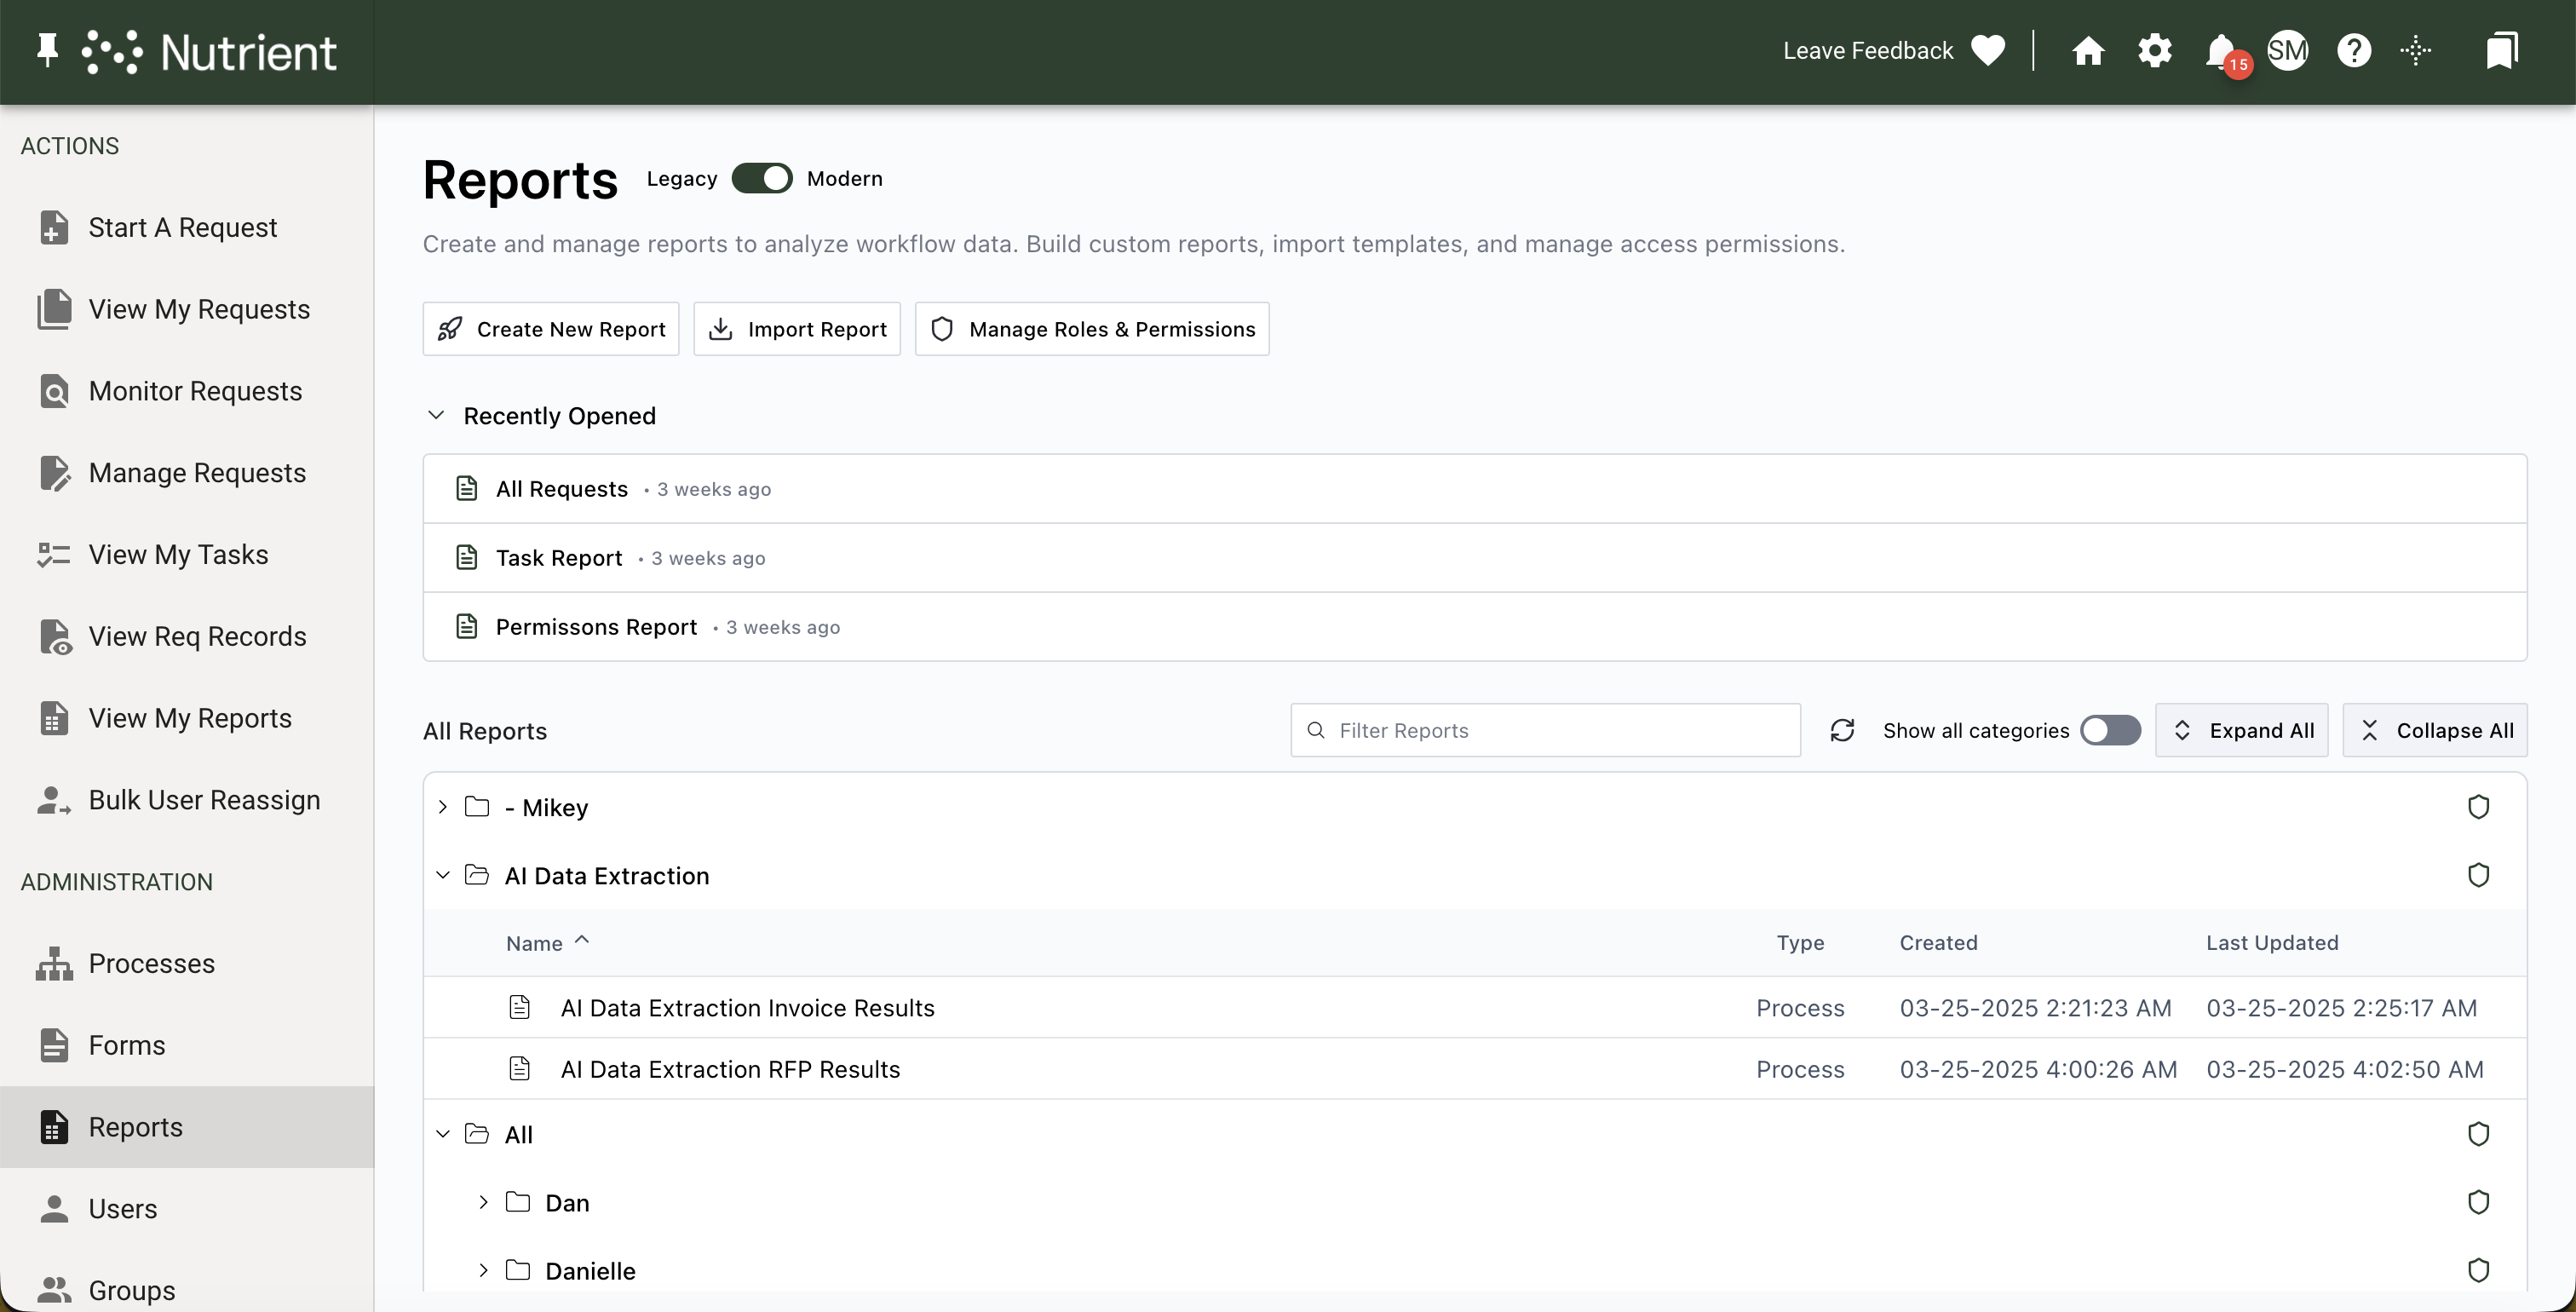
To access reports, navigate to the Reports tab in the left navigation panel. Click Create New Report at the top of the page to create a new report.
Guides Reports library overview Learn how to navigate the Reports library, create and import reports, and configure user roles and permissions.
Planning Reports Learn how to create targeted reports that enhance decision-making by understanding process structures and retrieving crucial data.
Creating reports Learn how to create, copy, delete, and export reports, and use API options for integration.
Report filters Learn how to effectively use report filters to enhance data analysis, streamline retrieval, and customize your reports for better insight.
Report limits Learn to set effective limits on reports to enhance data retrieval and management with flexible date ranges and user-specific options.
Report chart options Learn how to enhance your reports with customizable chart options and data visualizations for better insights.
Report columns Enhance your Integrify reports by adding, deleting, and formatting columns for streamlined data presentation and insightful decision-making.
Manage Task report column Learn how to use the Manage Task column to enhance task management in your reports and empower team leads to perform key actions.
Manage task reports Learn how to use the Manage Task feature to create customized reports and improve task management efficiency without full permissions.
KPI Overview Learn how to effectively integrate KPIs into your processes to measure efficiency and enhance decision-making with insightful dashboards.
Defining process KPIs Learn to add KPIs to your process design with our guide. Optimize your dashboards and enhance process tracking easily.
Displaying KPIs for an individual request Learn to display KPIs effectively in Request Detail and Dashboards, enhancing process monitoring with color-coded indicators for performance assessment.
Adding process KPIs to a dashboard Follow our step-by-step guide to add and configure KPIs on your dashboard for effective performance tracking and data visualization.
Thank you for your feedback!
Something went wrong. Please try again or let us know.