Demystifying grids
This webinar provides guidance on using process grids and custom reports in Nutrient Workflow, including importing processes, running requests, and creating SQL-based reports with dynamic data integration.
Full webinar recording
Instructions for using the process and reports together
- Import the process.
- Run at least one request.
- Import the standard report into your system.
- Copy the SQL code from the standard report that you imported into your system into a new custom report.
Comment out the lines for the date limits in the where clause or the report won’t run.
- Add the block of code below in the same area as the highlighted gray code in the screenshot below:
WITH (\ --field labels (column header names) with spaces get wrapped in double quotes\ Item varchar(100) N'$."Item #"', -- Select List\ Con_Line varchar(100) N'$."Con Line #"',\ Description varchar(100) N'$.Description',\ Unit varchar(100) N'$.Unit',\ Qty varchar(100) N'$.Qty',\ Price varchar(100) N'$."Unit Price"',\ Total varchar(100) N'$."Total"'\ ) 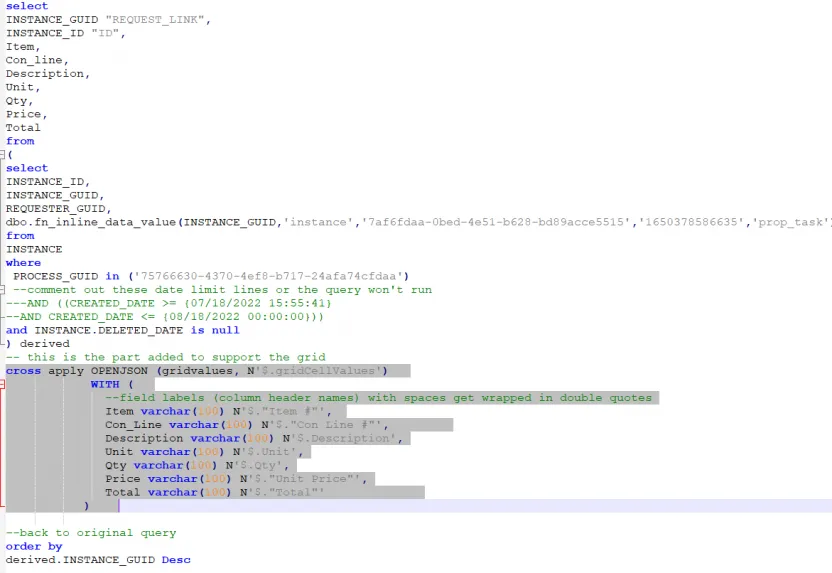
- Save the new query.
- Click Generate Columns.
- Preview the report.