Report usage and audit activity
Report usage tracking helps administrators understand how reports are being used in Nutrient Workflow Automation. You can enable tracking for individual reports, review execution history, and monitor reporting activity across the system.
Use this feature to:
- Review when a report was run.
- View who ran the report.
- Identify whether a report was run from the user interface, an API call, a dashboard, or a schedule.
- Monitor report activity trends, performance, and stale reports.
Access to report audit data and usage views depends on your report and administration permissions.
Enable usage tracking for a report
To enable usage tracking for a report:
- Navigate to Administration > Reports.
- Open the report you want to track.
- On the Report Detail tab, select Enable usage tracking.
- Enter a value in Audit log retention (days).
- Click Save.
The retention value controls how long audit records are kept for that report. After the retention period ends, older audit entries are removed automatically.
Review a report’s audit log
After usage tracking is enabled, open the report and select the Audit Log tab.
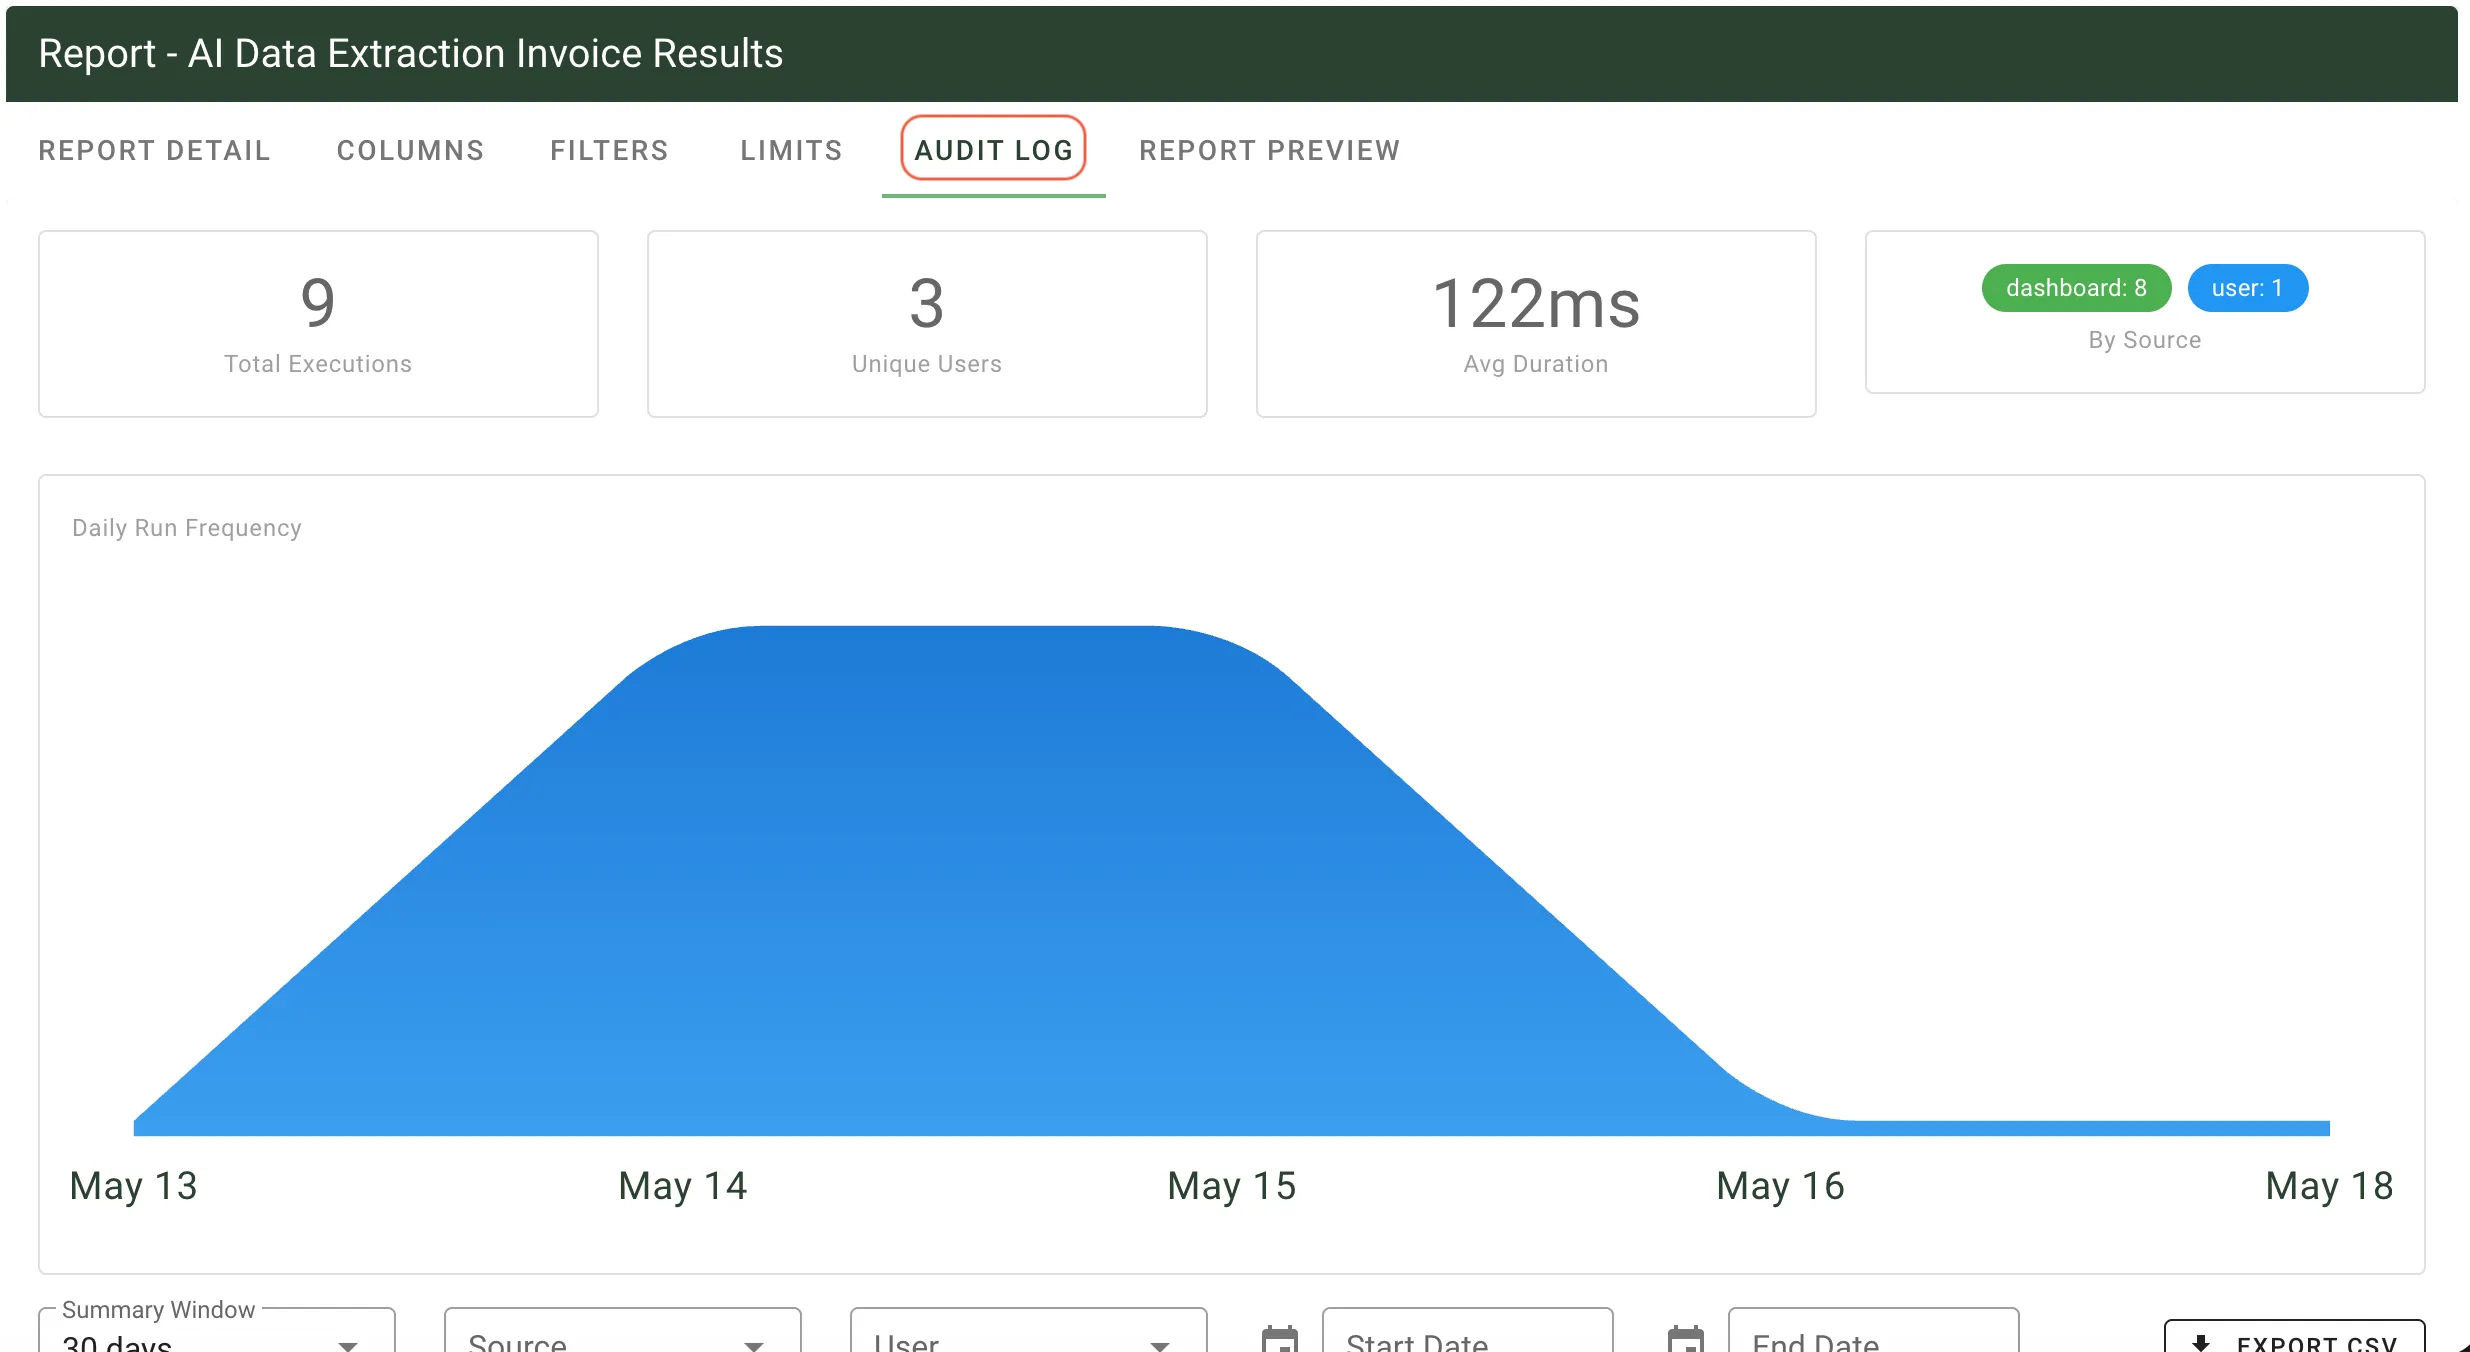
The Audit Log tab provides a report-specific view of usage activity. It includes summary cards for:
- Total Executions
- Unique Users
- Avg Duration
- By Source
If enough history is available, the page also shows a Daily Run Frequency chart to help you spot trends over time.
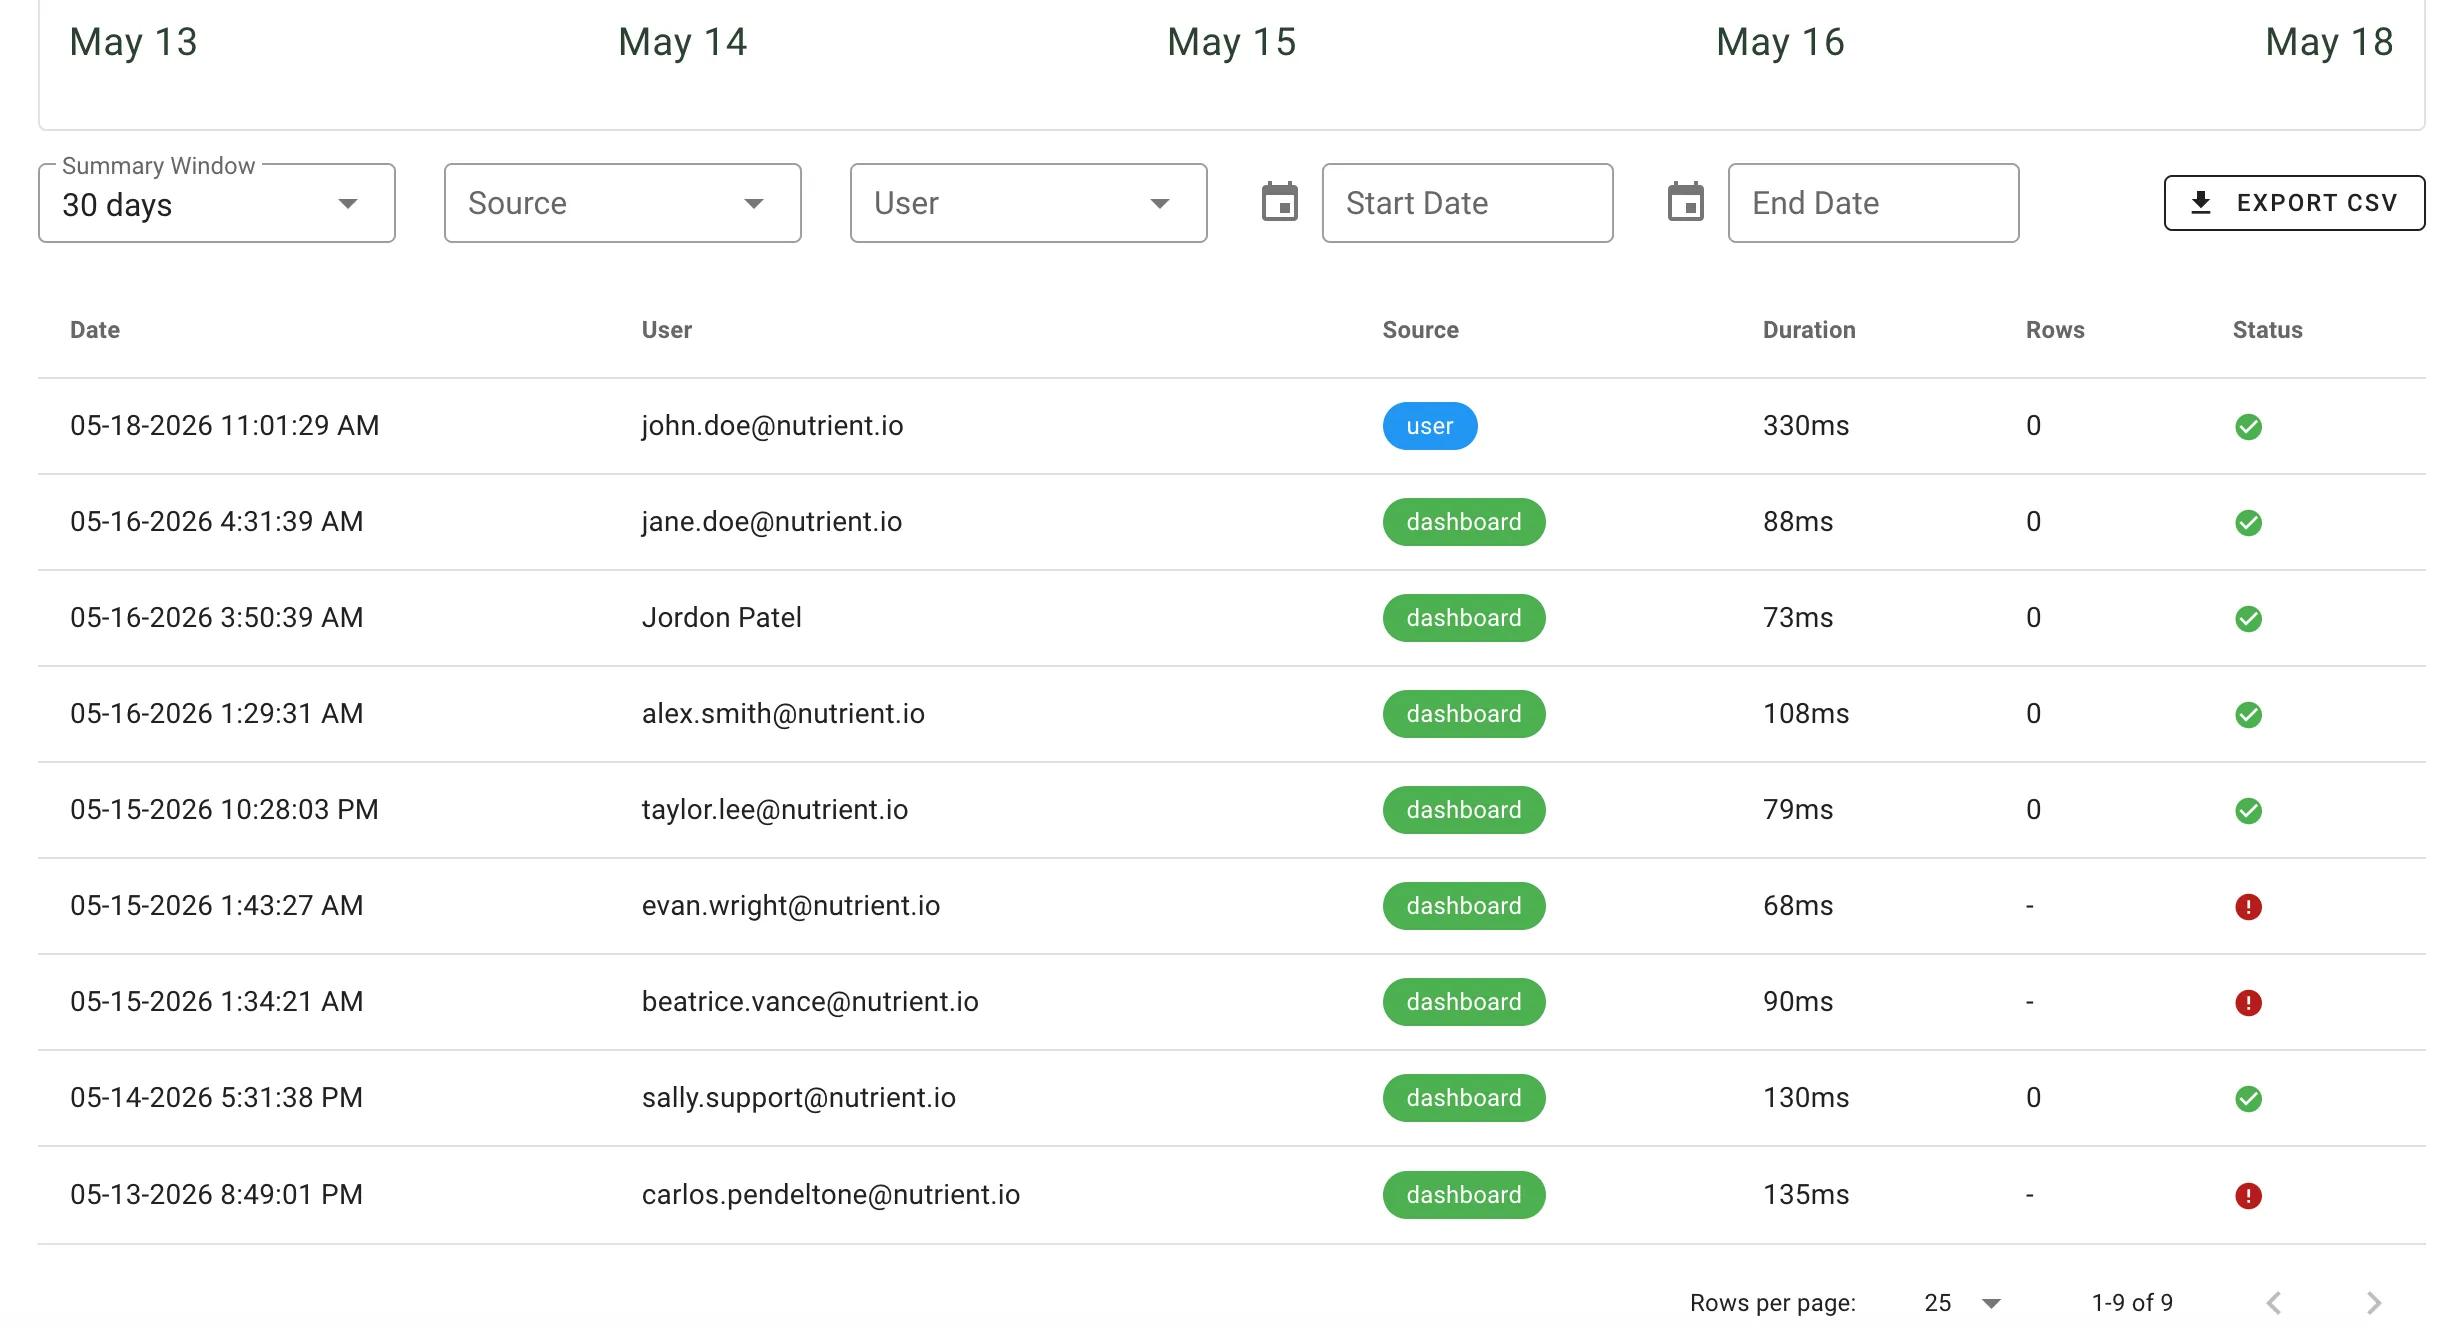
Filter and export audit data
Use the filters on the Audit Log tab to narrow the results:
- Summary Window
- Source
- User
- Start Date
- End Date
The audit table shows details for each report run, including:
- Date
- User
- Source
- Duration
- Rows
- Status
To download the filtered results, click Export CSV.
Review usage across all reports
To review report activity across the system, navigate to Administration > Reports, and click Report Usage in the upper-right corner.
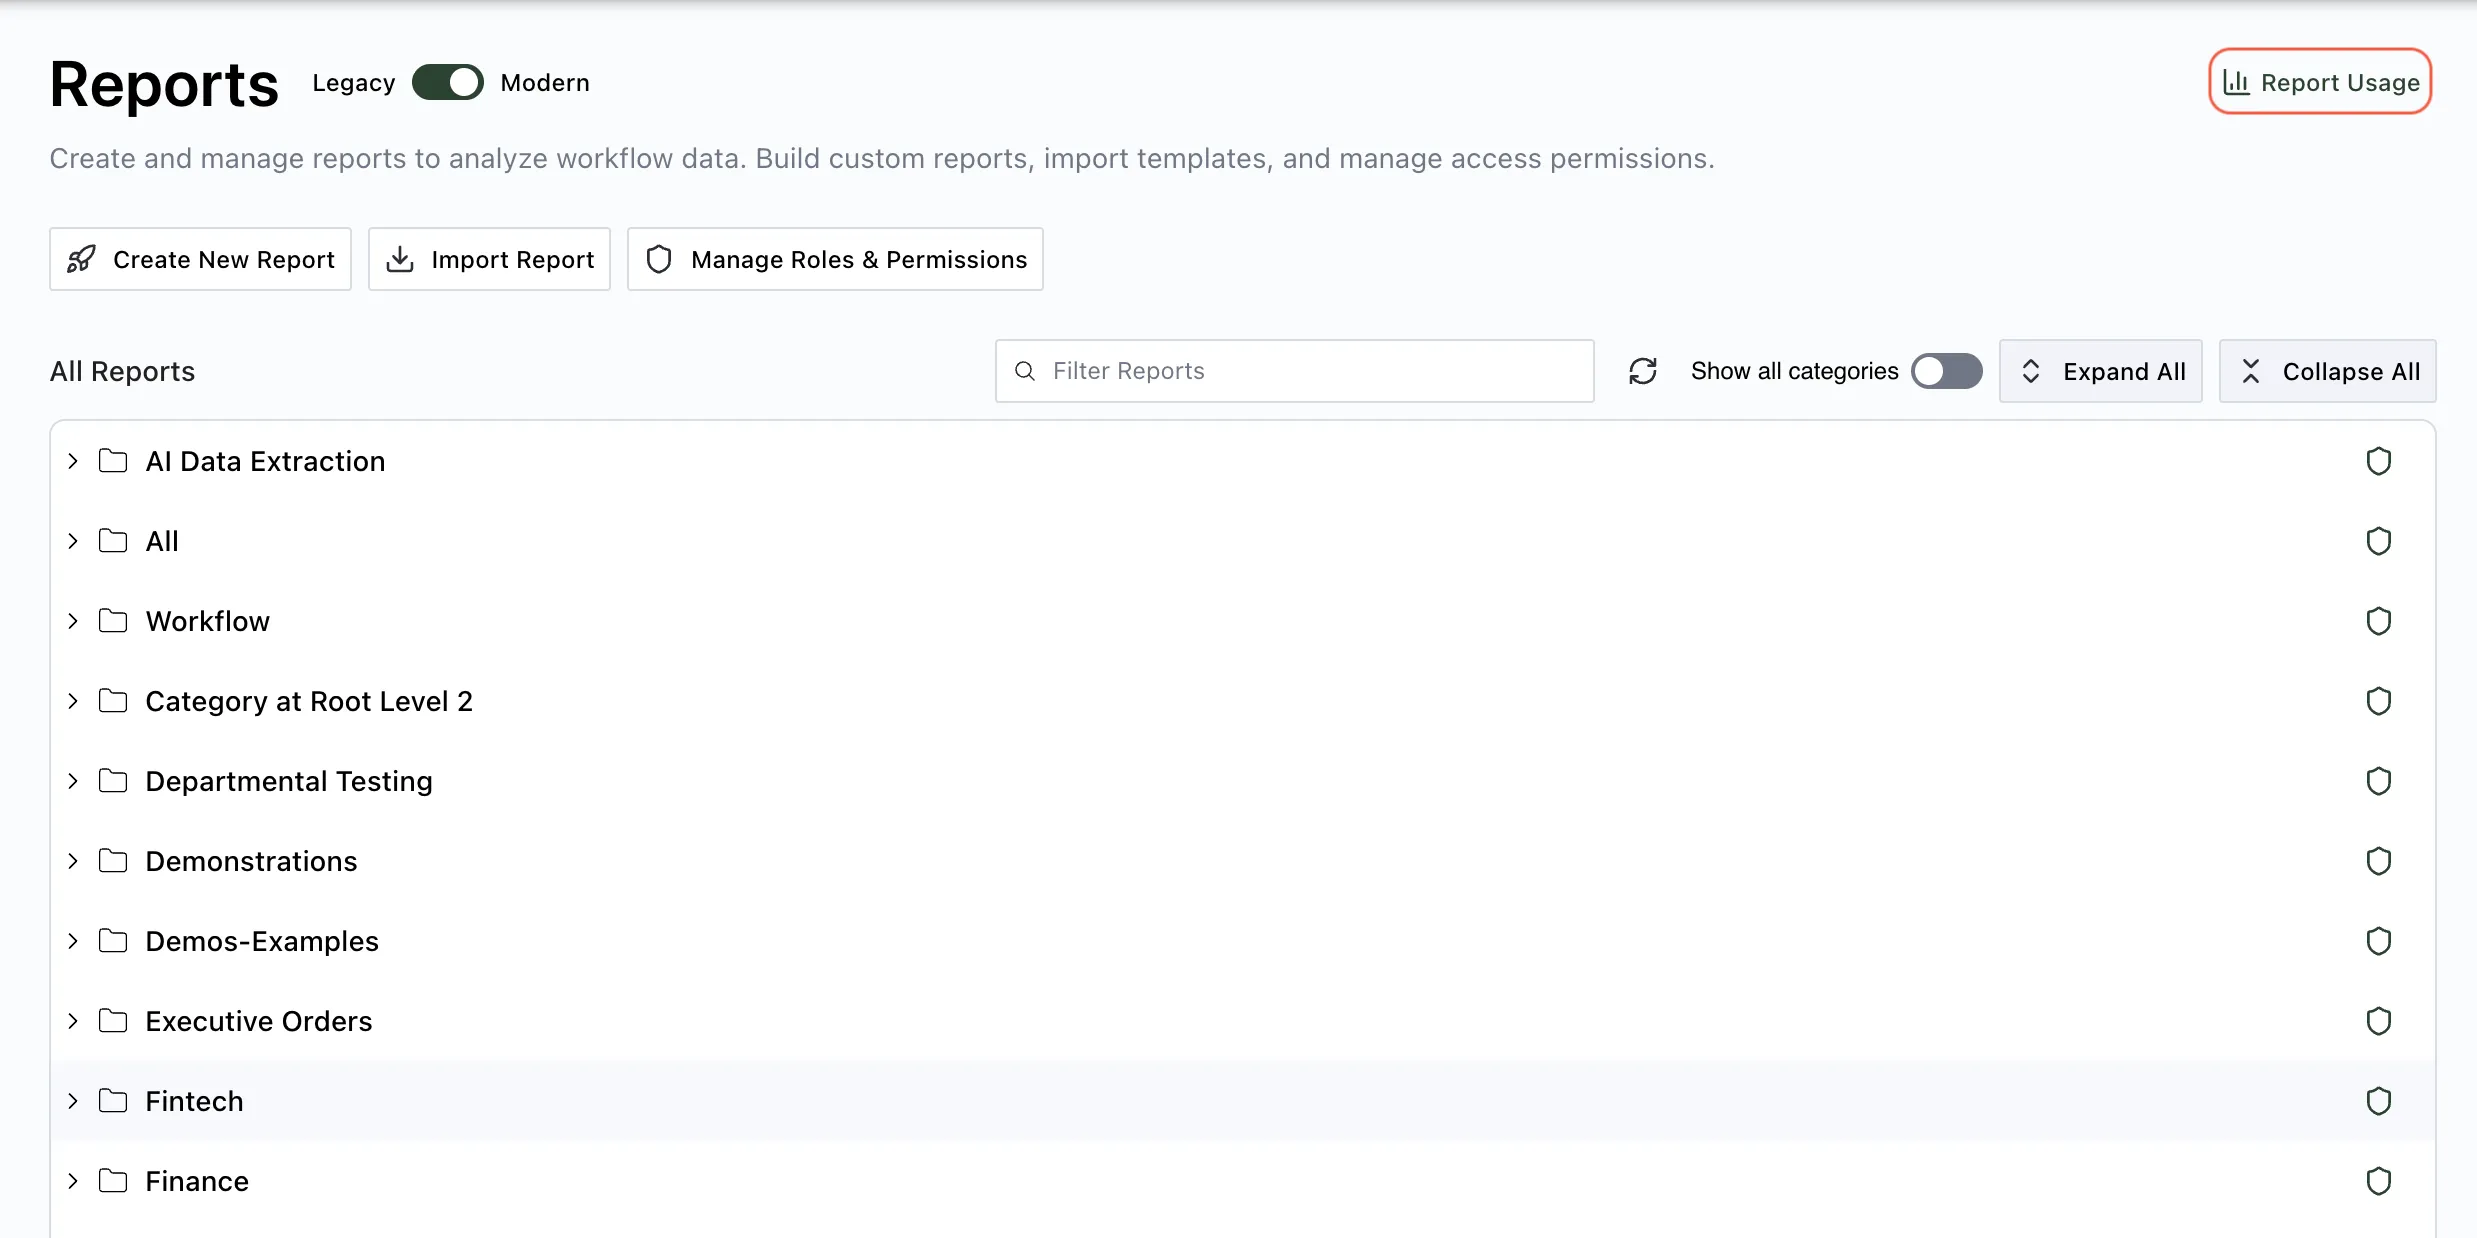
The Report Usage Overview page helps administrators identify the most-used and least-used reports.
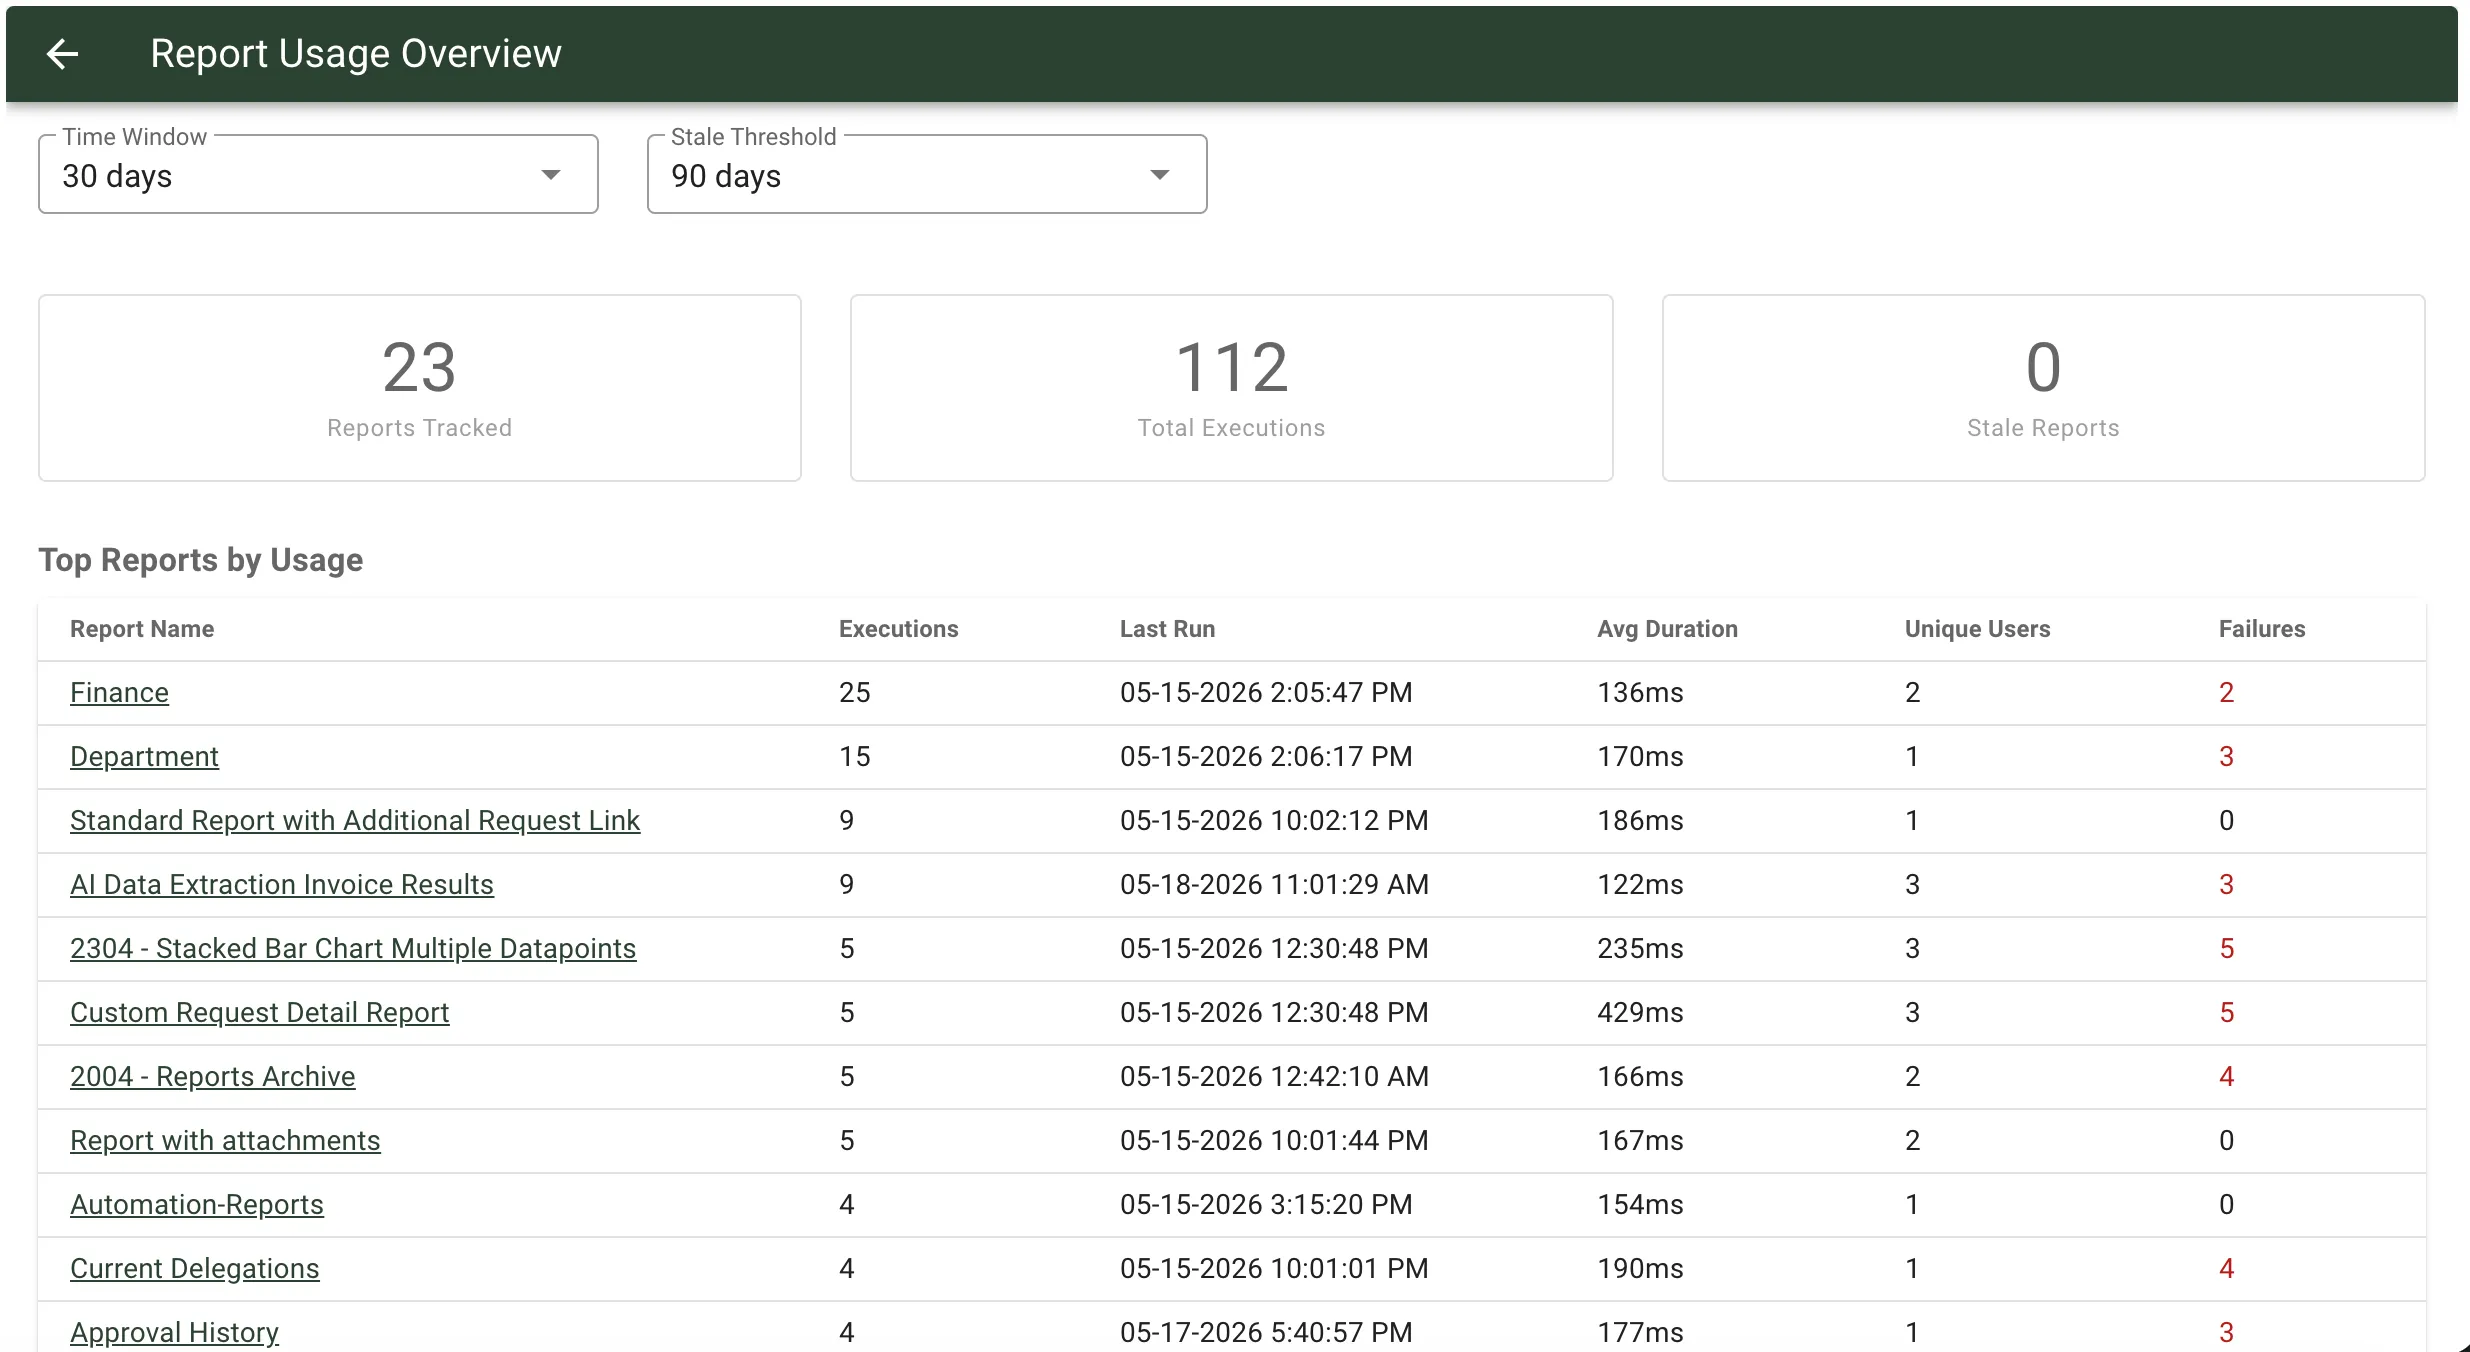
Use this page to:
- Adjust the Time Window for recent activity.
- Set the Stale Threshold used to identify inactive reports.
- Review summary cards for Reports Tracked, Total Executions, and Stale Reports.
- Review the Top Reports by Usage table.
- Review the Stale Reports table.
You can click a report name in either table to open that report directly.
Understand report sources
Usage tracking groups report executions by source:
- User — The report was run directly by a user.
- API — The report was run through an API request.
- Dashboard — The report was run from a dashboard widget.
- Schedule — The report was run by a scheduled job.
These source labels help you understand how reporting activity is distributed across your environment.
For more information about creating and managing reports, refer to the reports library overview and creating reports guides.