Mastering report columns in Workflow Automation
A column of data in a Workflow Automation report may be anything from the value of a question submitted on the form to the first name of the individual who started a request.
This section covers:
- Adding a column to a report
- Deleting a column
- Changing column names
- Manipulating column width
- Editing column format
- Defining column sorting
- Adding aggregates
Adding a column
To view the available columns on a report, select the Columns tab:
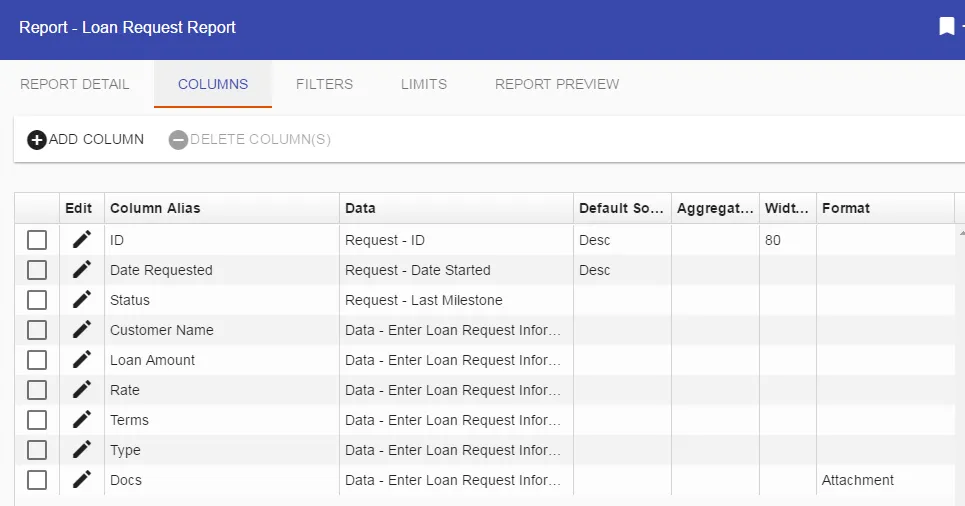
The Columns tab lists every column selected for this report.
To add a new column to a report, select the Add Column button. The following dialog opens.
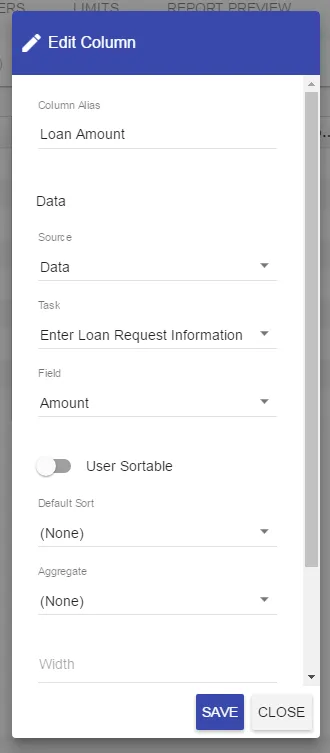
This dialog works like the transition editor used to configure process rules: Choose from the available Sources within the process (or processes) to select the data to display.
This dialog changes dynamically based on the Source selected. For instance, selecting Data as the source updates the dialog to show a list of available tasks in the process, along with the data attributes associated with each task.
If the report covers more than one process, choose the process before selecting from the list of tasks.
The example above uses the form task Enter Loan Request Information. The Field options list that form’s available questions, any of which can be displayed on the report.
The following is a high-level breakdown of each available Source:
| Source | Description |
|---|---|
| Client | Profile information associated with the Client of the process, such as name, division, cost center, location, etc. |
| Client’s Manager | Profile information associated with the Client’s Manager of the process, such as name, division, cost center, location, etc. |
| Data | The Data option enables you to select any data associated with a given task. Selecting Data opens a secondary dropdown list of available tasks, and the available data elements vary depending on the type of task selected. For a Form task, select data from the questions submitted on the form; for an Approval task, retrieve the approval option a user selected when they completed the task. |
| Request | High-level data associated with an overall request, such as the request ID, the date started, the date completed, the last milestone, the last milestone date, etc. |
| Requester | Profile information associated with the Requester of the process, such as name, division, cost center, location, etc. |
| Requester’s Manager | Profile information associated with the Requester’s Manager of the process, such as name, division, cost center, location, etc. |
| Status | Current status of a task in the process (i.e. completed, initialized, or in progress). |
| Task | High-level data associated with a specific task in the process, such as the task name, date started or completed, and task status. |
| Task Completer | Profile information associated with the person who completed a specific task within the process. You’ll need to select both the task and the profile attribute you’d like displayed. |
| Task Completer’s Manager | Profile information associated with the manager of a person who completed a specific task within the process. You’ll need to select both the task and the profile attribute you’d like displayed. |
| Task Recipient | Profile information associated with the person who was a recipient of a specific task within the process. You’ll need to select both the task and the profile attribute you’d like displayed. |
| Task Recipient’s Manager | Profile information associated with the manager of a person who was a recipient of a specific task within the process. You’ll need to select both the task and the profile attribute you’d like displayed. |
| Task Report Only Source Options Below (available only for task reports) | |
| Any Data | Option to get to data via a generic identifier (Label, ID, Property). If you want to pull back any data associated with the known ID (i.e. question ID or form ID), you can use this. |
| Current Task | Option to define the attributes for the current task. Commonly used to view how many tasks are assigned to users, total counts of tasks, time between task assignments and completions, etc. |
| Data (Matching Iteration) | Task reports can display and filter data or attributes from tasks corresponding to the iteration of the current task record. Also, iteration number can be displayed and filtered (choose under the Current Task source option to display as a column in a report). Useful for looping requests and displaying data from multiple tasks within each loop in the same row. |
| Fixed Value | Option to enter a fixed value associated with a task. |
| Task (Matching Iteration) | Task reports can display and filter data or attributes from tasks corresponding to the iteration of the current task record. Also, iteration number can be displayed and filtered (choose under the Current Task source option to display as a column in a report). Useful for looping requests and displaying data from multiple tasks within each loop in the same row. |
By nature, Any Data queries are non-indexed, full table scans. Use Any Data thoughtfully, as it can result in poor performance.
For Task Reports, choose data from a current or specific task — such as its due date, scheduled date, or reminder date — or select additional data options like Past Due information or metric data.
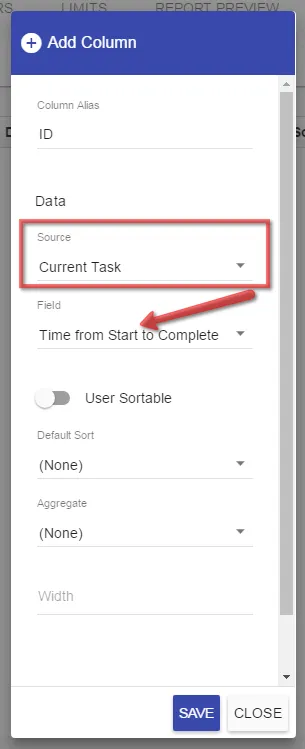
Once you’ve selected the column to add, select Save on the column selection dialog to update your column list.
Deleting a column
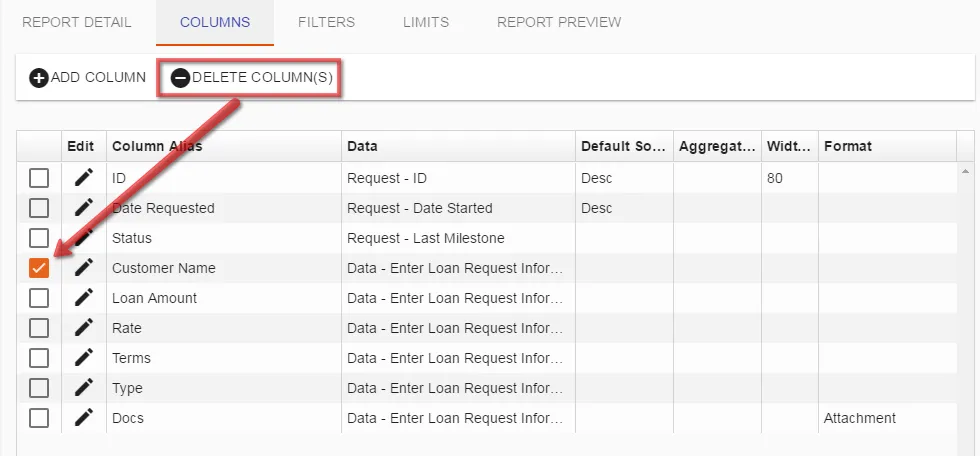
When deleting a column, check the column you want to delete and select the Delete Column option.
Changing column names
By default, a new column receives a default name based on the data it represents, such as Data or Form Name.
To use a more descriptive name, select the Edit pencil icon for the column. Then update the Column Alias field.
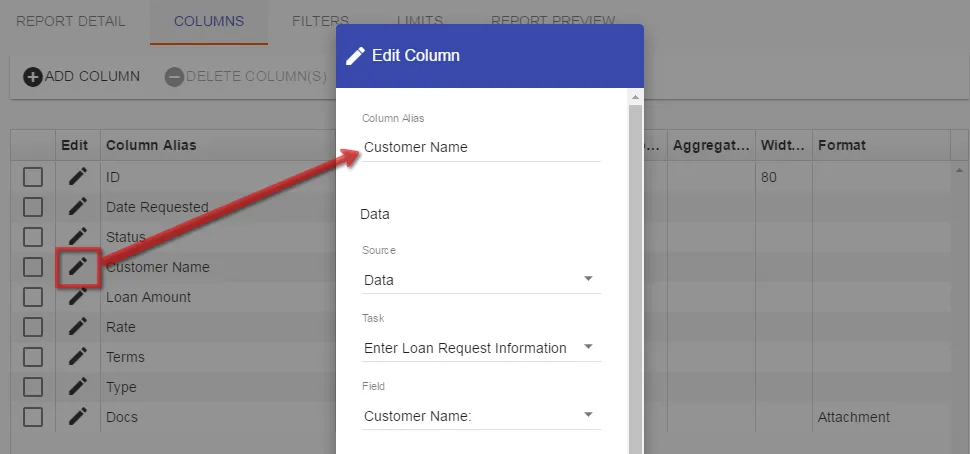
Type the new Column Alias in the field provided and select Save.
Column width
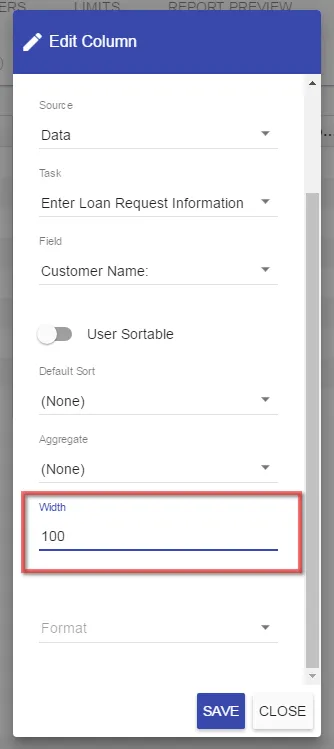
Set a specific width for the column by entering a value, as shown below.
Column format
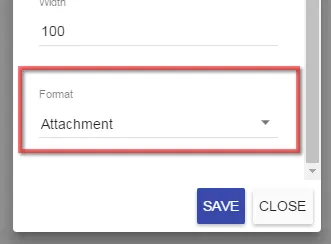
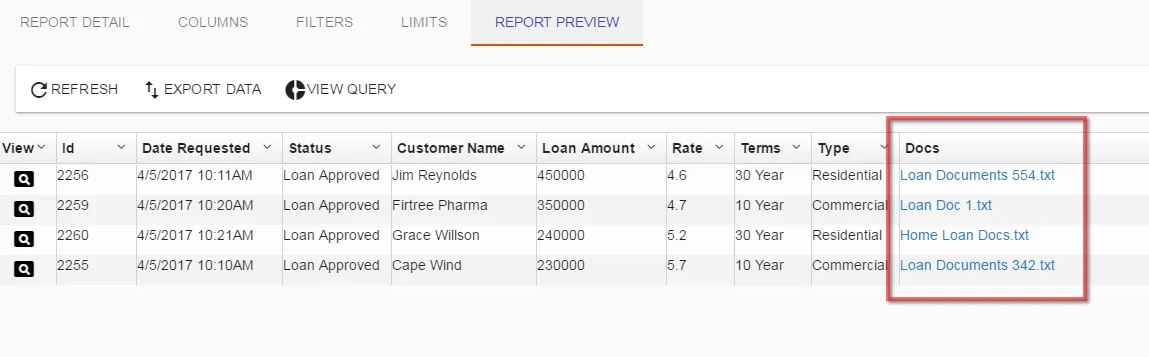
Control how the report displays a data field’s value by setting its column format. For example, formatting a field that holds a file attachment as Attachment lets anyone running the report open the file directly from the report view. Attachment links in reports resolve the specific file version associated with the report row. This helps preserve accurate historical references when users preview or download attachments from report results.
The image below shows an example of the column’s links to the file attachments.
Formatting options include:
- String (Text) — Displays the value as plain text.
- Date — Displays the date and time.
- Date (UTC) — Displays the date and time in UTC.
- Short Date — Displays only the date.
- Time — Displays only the time, in hours and minutes.
- Number — Displays the value as a number.
- Hyperlink — Displays a clickable link.
- Attachment — Displays a link to the attached file.
- Attachment - Icon — Shows the same attachment link as a paperclip icon instead of the filename.
- Request Link — Displays a link to the associated request.
- Task Link — Displays a link to the associated task.
If your administrator has enabled attachment export, users running the report can also download every file in its attachment columns — in either the Attachment or Attachment - Icon format — as a ZIP archive, rather than opening each row’s links one at a time. This requires the report to identify the request each row belongs to, through a Request Link, Intranet Request Link, or Request ID column. For more information, refer to the exporting report data guide.
Sorting columns
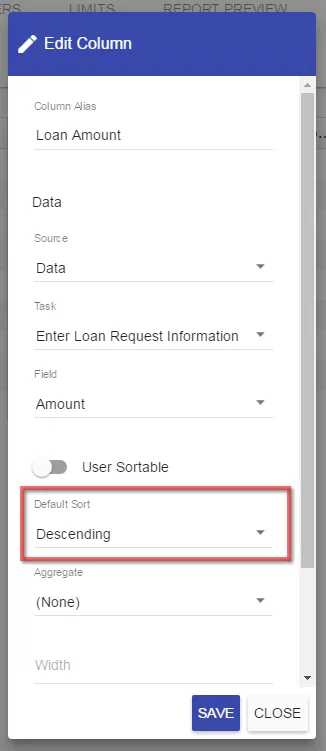
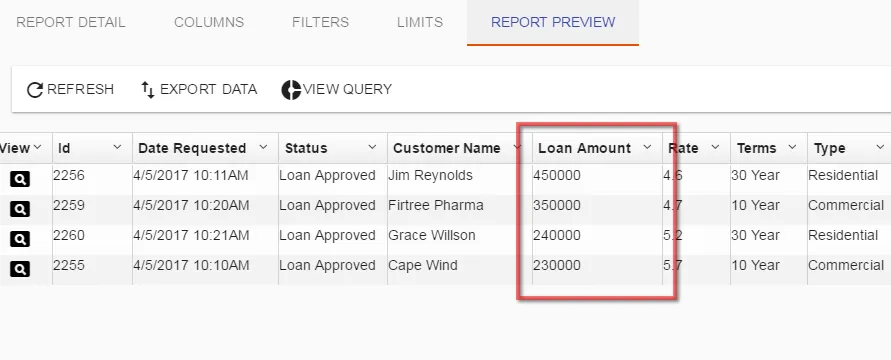
Choose whether a column sorts ascending or descending when the report runs (for example, sort descending by the Amount column).
Adding aggregates
To add an aggregate function such as sum, min, max, average, or count on a particular column, start by selecting the aggregate field.
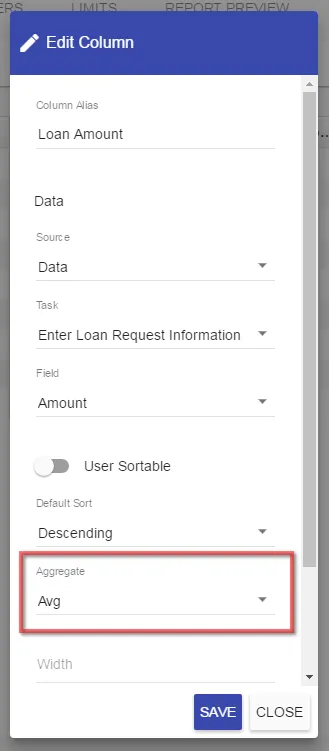
A list of available functions for the column appears. Select the aggregate function to use. Then press Save.
How an aggregate function behaves also depends on the report’s other selected columns. For example, displaying the Request ID alongside a Sum aggregate on a cost value (a form question) prevents the reporting engine from aggregating correctly, because Request ID is unique per row.
Selecting a value such as Last Milestone — which is represented as a single value within a given request — lets the reporting engine correctly perform a Sum on the same cost value.
When using aggregate functions, choose other report columns whose values are shared across multiple requests. This lets the reporting engine group rows correctly before calculating the aggregate.